

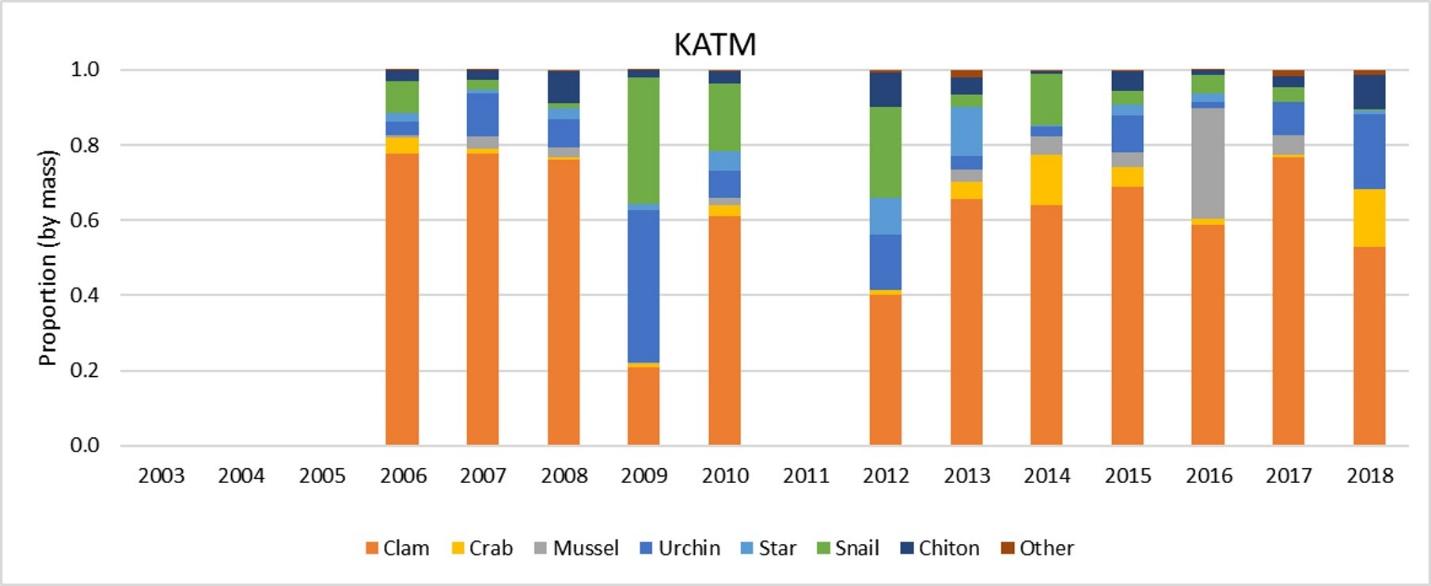
FIGURE 2. SEA OTTER PREY PROPORTIONS BY REGION: WPWS (2003-2005, 2007, 2010-2018), KEFJ (2007-2018), KBAY (2017-2018, COMBINED DUE TO LOW SAMPLE SIZE IN 2017), AND KATM (2006-2010, 2012-2018).
FIGURE 2. SEA OTTER PREY PROPORTIONS BY REGION: WPWS (2003-2005, 2007, 2010-2018), KEFJ (2007-2018), KBAY (2017-2018, COMBINED DUE TO LOW SAMPLE SIZE IN 2017), AND KATM (2006-2010, 2012-2018).