

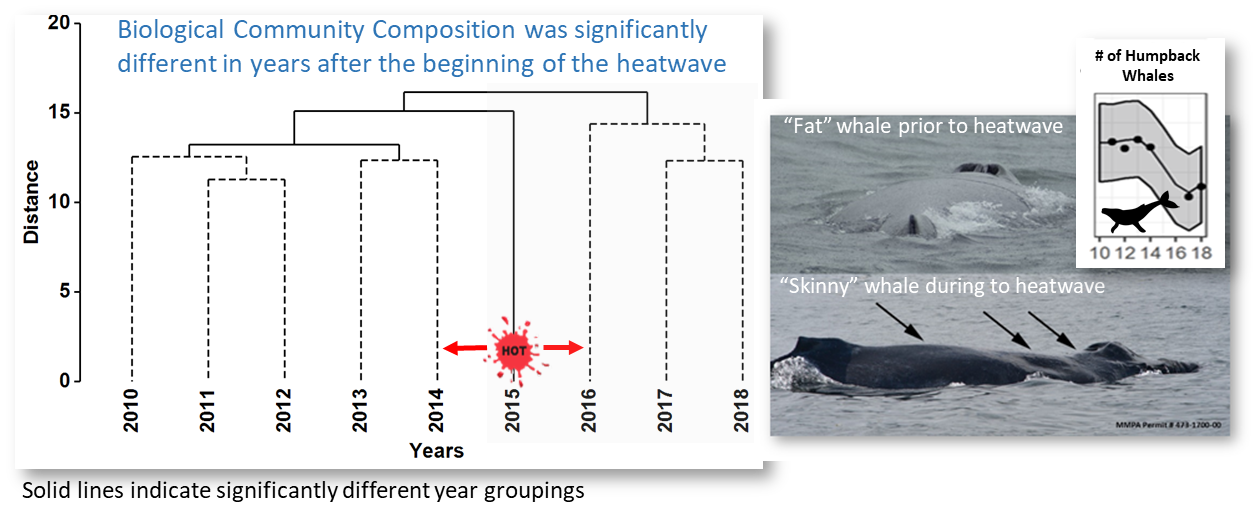
An analysis of 113 biological time series showed that Gulf of Alaska communities were markedly different during and after the onset of the heatwave in 2014 compared to before. Image of a robust (“fat” and healthy) whale before the heatwave and a “skinny”, nutritionally stressed whale during the heatwave (arrows indicate where lack of blubber makes bone contours visible under the skin).