

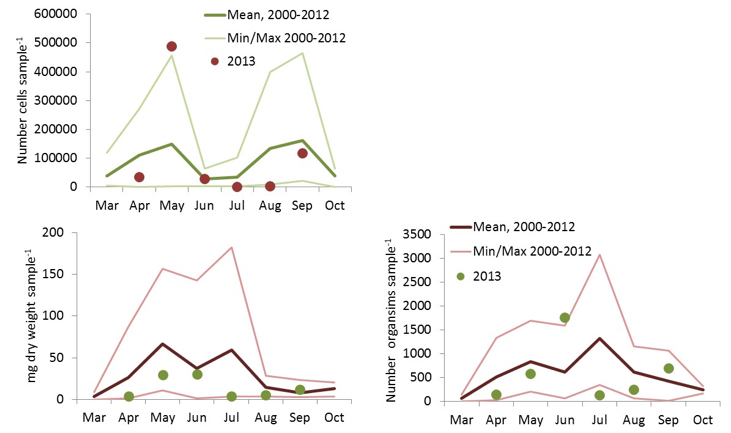
Figure 1 Caption: Preliminary results from 2013 CPR sampling as monthly means overlaid on the monthly means of a long-term time series of CPR observations from the Alaskan Shelf/Cook Inlet region. The upper graph shows mean diatom abundance; the lower graphs show zooplankton biomass (left) and abundance (right).