

Who We Are
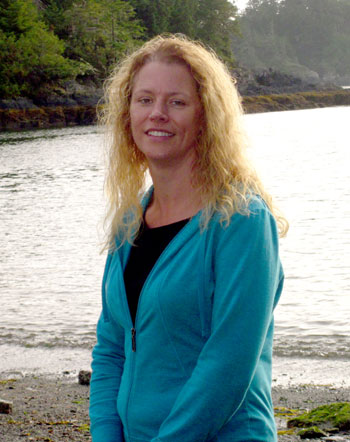
Clare Ostle, Marine Biological Association
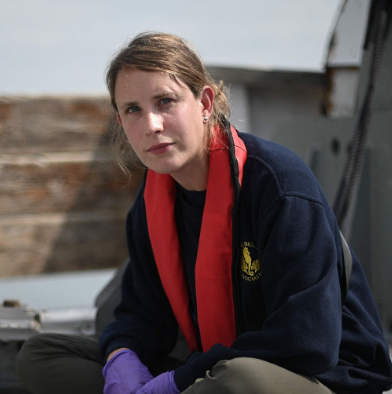
Sonia Batten, PICES
![]()
Phytoplankton bloom
with warmth of light’s return
Ocean life renewed
Why are we sampling?
Plankton, the organisms that drift with ocean currents, are the base of every marine food chain. Both phytoplankton (plant) and zooplankton (animal) are sensitive to physical, chemical and biological changes in the environment and respond rapidly to a range of environmental stressors. Subtle changes in the plankton community, such as in the types and abundance of different plankton species, in the size range of plankton, in the timing of an annual plankton bloom, or in the total biomass of phytoplankton and zooplankton, can have profound effects on the species at higher levels in a marine food web. In the Gulf of Alaska, the higher-level species include marine mammals, seabirds, and salmon, as well as herring, sand lance, and capelin, known collectively as “forage fish” because they have so many predators. Many predators migrate between the area affected by the Exxon Valdez oil spill on the shallow Gulf of Alaska continental shelf and offshore waters. Some depend on prey that migrate between the two types of habitats. An understanding of the productivity of both the continental shelf and offshore areas is therefore important to our overall understanding and to predictions of changes in the abundance of animals throughout the oil spill-affected area.
The objective of the Continuous Plankton Recorder (CPR) project is to sample plankton from ships that make repeated transits across the Gulf of Alaska. These are called “vessels of opportunity” because they are not research vessels – they are cargo ships that carry CPR instrumentation. As a vessel of opportunity makes its transit, the CPR collects data about the abundance and biomass of different types of plankton continuously. Plankton data collected in this way in the Gulf of Alaska during spring and summer seasons since 2000 and the data have been summarized and analyzed on a monthly basis. These data have proved important in helping us understand factors that may have caused changes within the ecosystem at different times and within different regions.
Where are we sampling?
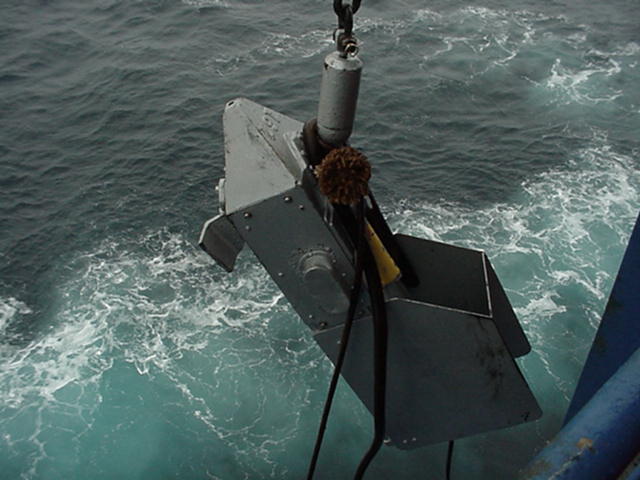
A continuous plankton recorder is lowered into the ocean to be towed behind a cargo ship.
Plankton data are collected on a path that begins in the open Gulf of Alaska crosses the “shelf break” where the sea bottom steeps sharply upward to the shallower continental shelf, and then crosses the inner part of Cook Inlet.
How are we sampling?
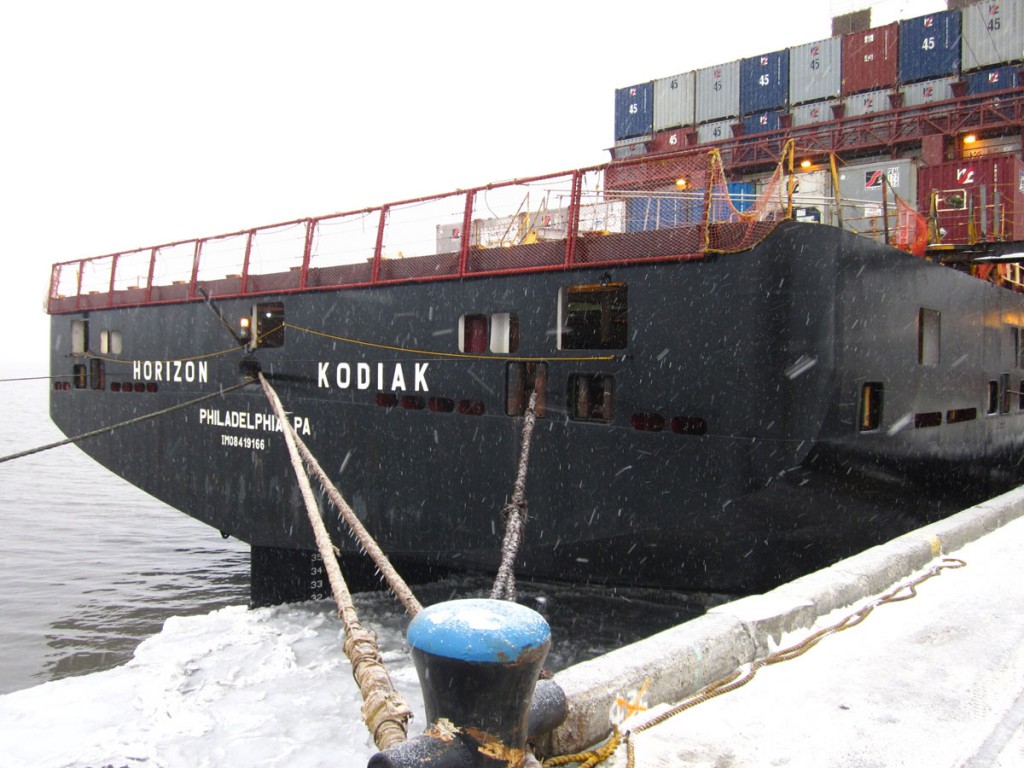
The cargo vessel Matson Kodiak tows the Continuous Plankton Recorder (CPR, pictured) northbound towards Cook Inlet approximately once per month between April and September each year. The samples are unloaded and the gear serviced each time by Alaskan technicians who have been trained by the Marine Biological Association (MBA). Sample processing is carried out at the Department of Fisheries and Oceans laboratory in Sidney, British Columbia and at the MBA laboratory where the plankton, the majority of which are microscopic, are identified and counted.
What are we finding?
Preliminary data from 2025 indicate notable shifts in plankton communities in the northern Gulf of Alaska. Early-season observations (March–June) show a higher proportion of large, round diatoms within the phytoplankton community compared to previous years. In the zooplankton community, small copepods were particularly abundant, while larger copepods, pteropods, and euphausiids were present in low numbers or absent in sampled months. Seasonal indicators also suggest that copepod body sizes were smaller than average during late spring and early summer, while overall zooplankton abundance was relatively high in June.
Although these findings are based on preliminary data, they suggest that 2025 conditions may have favored smaller-bodied zooplankton during the spring and early summer period. Continued data processing and analysis will help clarify how these patterns relate to broader environmental drivers and ongoing ecosystem change.

Left panel shows the mean annual percentage of the total phytoplankton. Right panel shows the mean annual percentage of the total zooplankton. 2025 only includes data from March and June and are preliminary. Red line is the annual Sea Surface Temperature (SST) within the Alaskan Shelf region from 2004 to 2025, obtained from the International Comprehensive Ocean-Atmosphere Data Set. The ICOADS SST dataset has not been updated beyond July 2025 so this is not a complete year of SST.