


Why are we sampling?
Intertidal communities are exposed to both air and water temperatures as tides flow in and out. As such, temperature is a strong driver of intertidal community structure (species composition and abundance; see Intertidal Communities) and can vary from very warm to below freezing in high latitudes. Temperature also can vary significantly on short (daily), seasonal, and longer-term time scales. Currently, we are experiencing more heat wave events but also a general warming due to anthropogenic causes. We monitor intertidal water and air temperatures continuously throughout the year at all sites in each region so that we can evaluate effects of varying temperature on intertidal community structure and trends in abundance of species of interest.
Where are we sampling?
We measure intertidal temperature at the same sites where intertidal communities are monitored in western Prince William Sound (WPWS), Kenai Fjords National Park (KEFJ), Kachemak Bay (KBAY), and Katmai National Park and Preserve (KATM). Data-logging temperature recording devices (HOBOs, see below) are deployed at 2 tidal heights: 0.5m above mean lower low water (MLLW) and 1.5 m above MLLW (low and mid-intertidal zones, respectively).
How are we sampling?
Temperature is measured using HOBO data loggers that record temperature several times per hour every day for the entire year. Because these instruments are deployed in intertidal areas, they record water temperature when the tide is in and air temperature when the tide drops below the level of the data logger. We retrieve and download the instruments every year to continuously track temperature at each site.
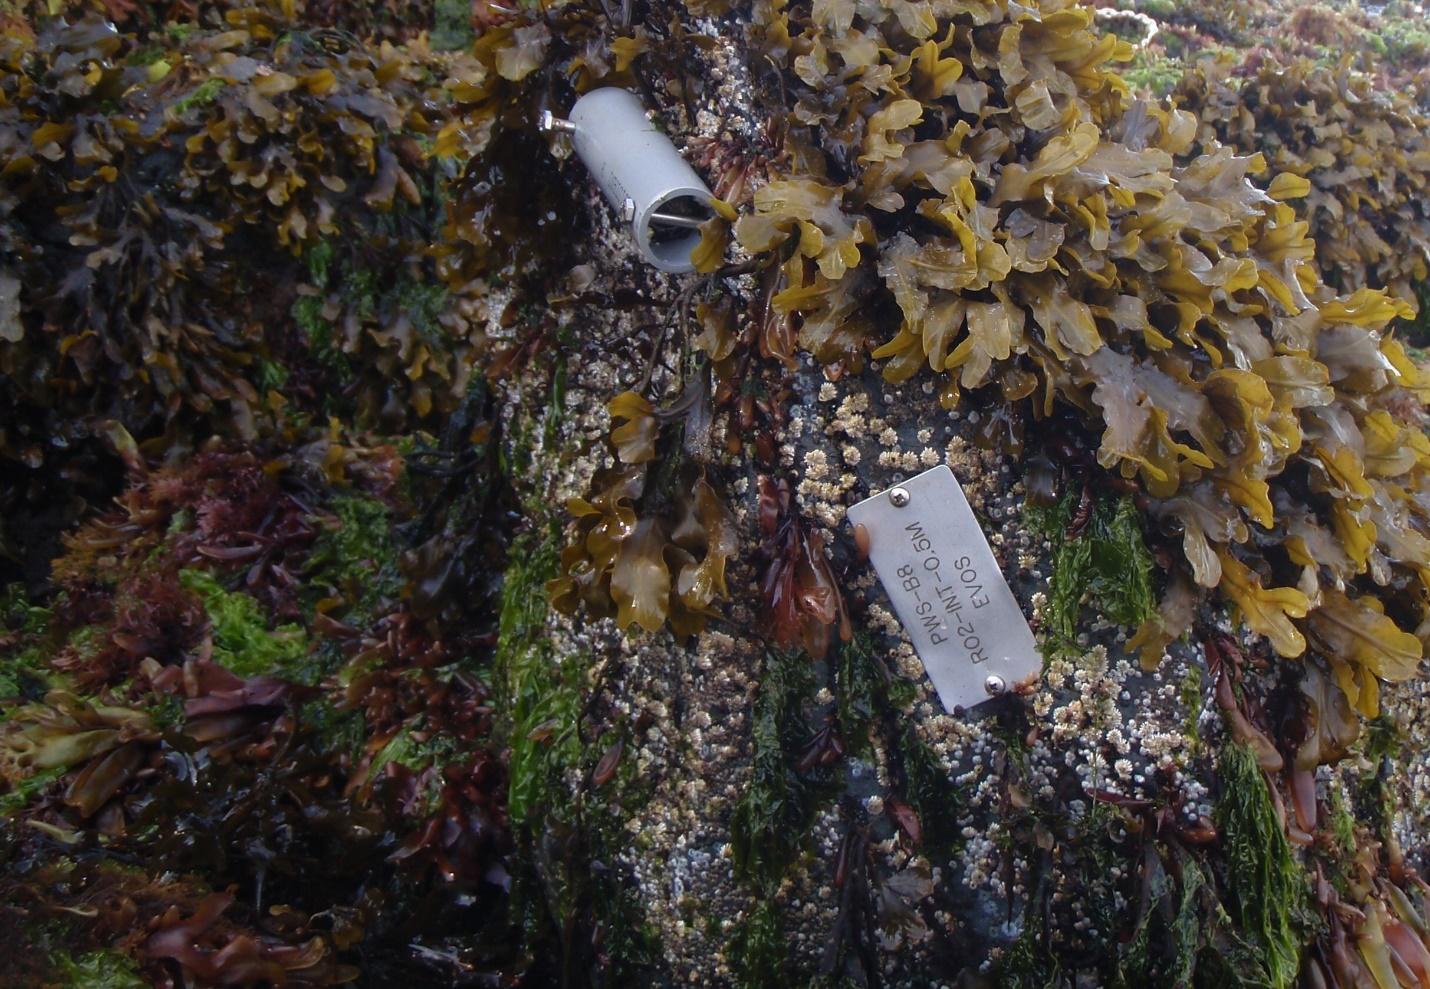
THE UNASSUMING PIECE OF GRAY PVC PIPE HOUSES A DATA LOGGER THAT RECORDS AIR AND WATER TEMPERATURES THROUGH THE YEAR. PHOTO CREDIT: DAN MONSON, USGS.
What are we finding?
Nearshore intertidal temperature records across the northern Gulf of Alaska show clear responses to large-scale oceanographic variability. Warming was observed beginning in 2014 and persisted through 2016, corresponding to the Pacific marine heatwave, with elevated temperatures recorded across all study regions. Following this period, temperatures generally returned toward average conditions in 2017 and 2018, although additional warm conditions were observed in 2019. More recent observations indicate continued variability, with periods of cooling and warming differing among regions. In 2025, intertidal temperatures were again above the long-term average at the time of sampling, indicating a return to warmer conditions across the regions surveyed. These observations demonstrate that large-scale climate events are consistently reflected in nearshore intertidal environments and contribute to ongoing variability in ecosystem conditions.
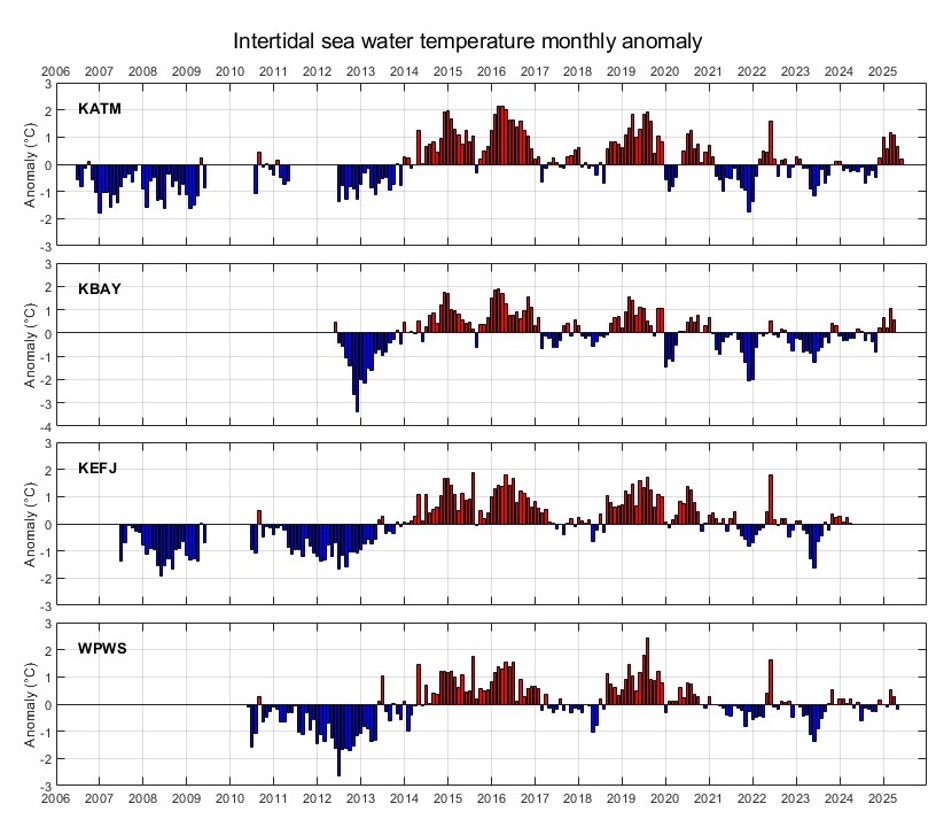
Monthly intertidal water temperature anomalies at the 0.5 m tide level four regions of the western Gulf of Alaska (west of 144°W), western Prince William Sound (WPWS; 2011-2025), Kenai Fjords National Park (KEFJ; 2008-2024), Kachemak Bay (KBAY; 2013-2025), and Katmai National Park adjacent to Shelikof Strait (KATM; 2006-2025). Tick marks indicate the start of the calendar year (January).