

Who We Are

Seth Danielson, University of Alaska Fairbanks
![]()
Continuously monitoring the coastal Gulf of Alaska over seasons, years, and decades.
Why are we sampling?
Temperature and salinity profiles in relation to depth have been taken at the oceanographic station GAK1 beginning in December, 1970. This multi-decade time series of oceanographic profile data is one of the longest in the North Pacific for any location. Averages of temperature and density (which is related to salinity) at selected depths show the annual cycle of changes in these two important environmental parameters over the long-term and help scientists understand climatic changes and how these translate into changes in oceanographic conditions.
Where are we sampling?
The station is located at the mouth of Resurrection Bay in the Gulf of Alaska and is the station closest to shore of the Seward Line ecological survey monitoring transect. The site is at 59° 50.7’ N, 149°28.0’W and is located within the Alaska Coastal Current, so the waters it monitors are well “connected” with water shelf circulating over the continental shelf in the Gulf of Alaska.
How are we sampling?

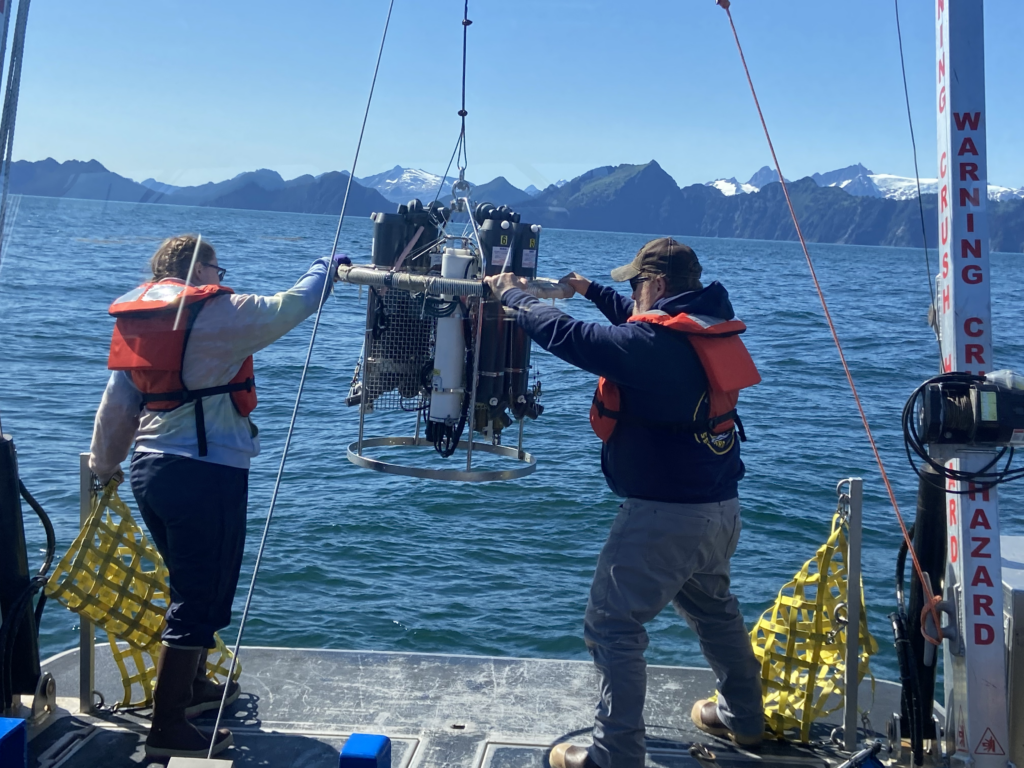
The GAK1 mooring staged for deployment.
For the first 20 years that sampling at the GAK1 station occurred, it was accomplished by “ships of opportunity,” comprised primarily of research vessels as they left or entered the port. The frequency of sampling thus varied from several times per month to several times per year. Since September 1990, the sampling has been accomplished on a nominally monthly basis from locally-operated vessels.
Today, the primary survey vessel is the 40’ R/V Nanuq, from which a single CTD (conductivity, temperature, depth) cast profiles the water column from the surface to within 10 meters of the ocean bottom. The CTD cast also collects water samples for analysis of nutrients and phytoplankton. A net towed through the upper 100 m of the water column collects zooplankton. A subsurface oceanographic mooring, first deployed in 1998, has multiple dataloggers that record conditions every hour.
What are we finding?
Long-term observations at station GAK1 continue to show clear changes in the physical structure of the northern Gulf of Alaska. Over the full record, the water column has warmed, with stronger warming near the surface than at depth. At the same time, surface waters have become fresher while deeper waters have become more saline, resulting in little overall change in total freshwater content but increasing vertical stratification, particularly during late winter and spring.
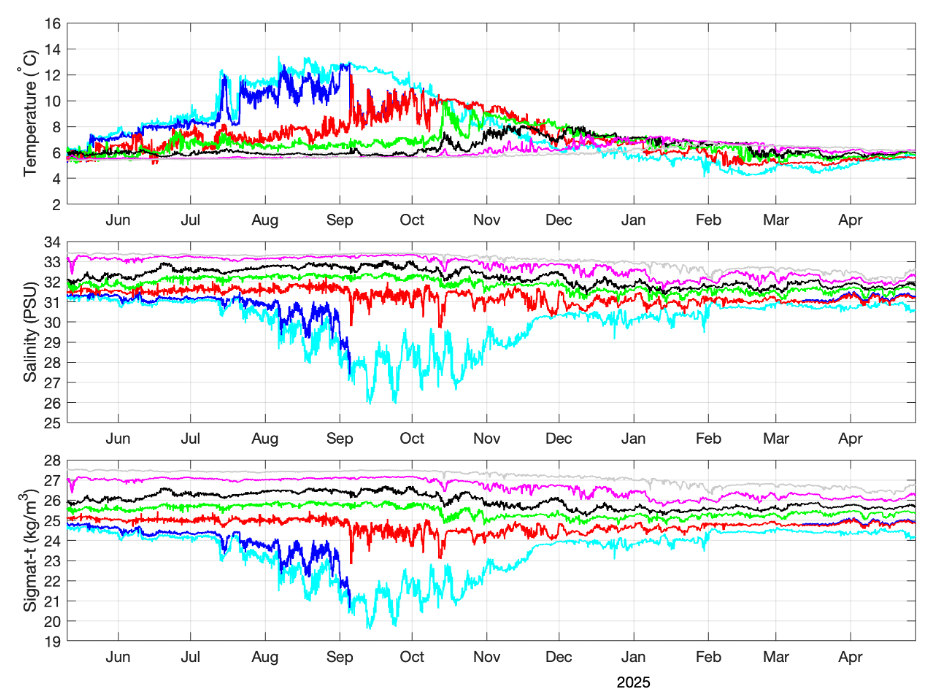
Data records from the 2024-2025 deployment of the GAK1 mooring, with temperature (top), salinity (middle) and density (bottom). Colors denote different instrument depths, with the 2024 sensors winding up near 18 m (cyan), 28 m (blue), 59 m (red), 102 m (green), 140 m (black), 191 m (magenta) and 245 m (gray).
Analyses also show that temperature and salinity vary on different time scales, with temperature anomalies persisting longer than salinity anomalies. These differences reflect distinct drivers, including atmospheric heating and cooling, freshwater runoff, and ocean circulation processes. Seasonal patterns indicate that late winter conditions play an important role in setting water column structure that can persist into subsequent months.
Recent observations and forecasts suggest that ocean temperatures in the northern Gulf of Alaska are likely to remain above average, with 2026 conditions projected to be warmer than the long-term mean. Continued warming and increasing stratification may influence the timing of spring phytoplankton blooms, the structure of zooplankton communities, and broader ecosystem dynamics through changes in energy flow across the marine food web.

Annual averages of the GAK1 monthly anomalies. Years with fewer than four months of data collected have been excluded from this figure.
The GAK-1 dataset is a crucial reference spanning half a century for assessing environmental conditions and changes in the Gulf of Alaska (GOA). Its value has been steadily increasing over time and has been utilized in a growing number of peer-reviewed publications, student theses and dissertations, and agency reports. This dataset plays a key role in understanding the region’s dynamics.