

Why are we sampling?
Intertidal bivalves, specifically mussels and clams, provide a critical prey resource for a variety of seabirds, marine mammals, fishes, and other invertebrates (e.g., sea stars). They also provide nutrients and energy to some terrestrial carnivores such as black and brown bears that seasonally forage in marine habitats. Bivalves also are important to humans for subsistence and recreational harvest. Mussels and clams constitute a large proportion of the diets of the black oystercatcher and the sea otter, two species that are central in the design of the Nearshore component of the Gulf Watch Alaska Program (see Sea Otters and Black Oystercatchers pages).
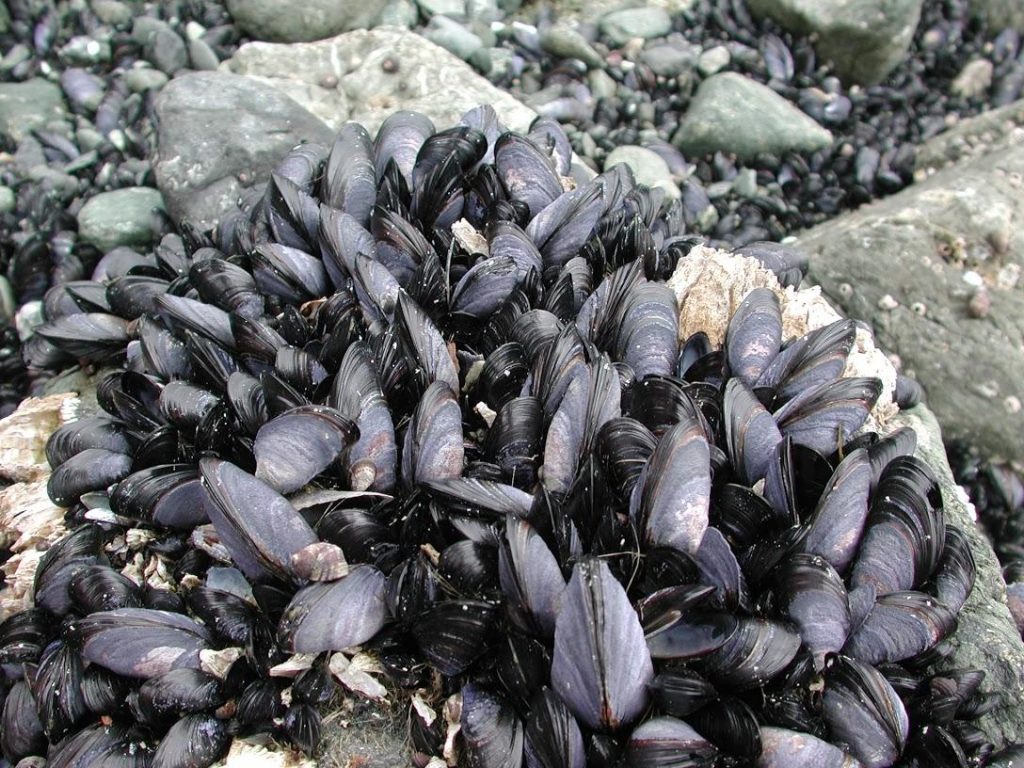
Two habitat types are widely recognized as supporting abundant bivalves. The first habitat type is the rocky intertidal that can have dense mussel beds. The second habitat type is soft-sediment (mud to cobble) intertidal beaches that support mussels and populations of several clam species. These clams are ecologically diverse in terms of habitat preferences (some species prefer more muddy/sandy habitats and others prefer cobbles), foraging strategies (e.g., filter-feeding or detritivores), and have a wide range of physiological tolerances. Measurements of bivalve diversity, density, size distribution, and contaminant levels are important for examining small (site to site) to large (among regions) scale variability and changes due to natural and anthropogenic forces. These metrics also provide useful inferences about changes in the environmental conditions as well as causes of change that can be detected in higher-level consumers that occupy nearshore food webs.
Where are we sampling?
We monitor bivalves at specific mussel beds and soft sediment beaches in close proximity to the sites where intertidal communities are monitored in western Prince William Sound (WPWS), Kenai Fjords National Park (KEFJ), Kachemak Bay (KBAY), and Katmai National Park and Preserve (KATM).
How are we sampling?
We sample mussel density, size class distribution, and mussel bed extent at specific mussel beds selected for their high abundance of mussels. We use measuring tapes to lay out transects and quadrats to define the area from which we are sampling. Our methods allow extrapolation of mussel abundance within the entire bed.
Clam species diversity, density, and size class are measured at the 0m tide level. We lay a tape along the 0m contour and then remove all sediment within a 0.5 X 0.5m quadrat, which is sifted to reveal the clams so that they can be identified, counted, and measured.
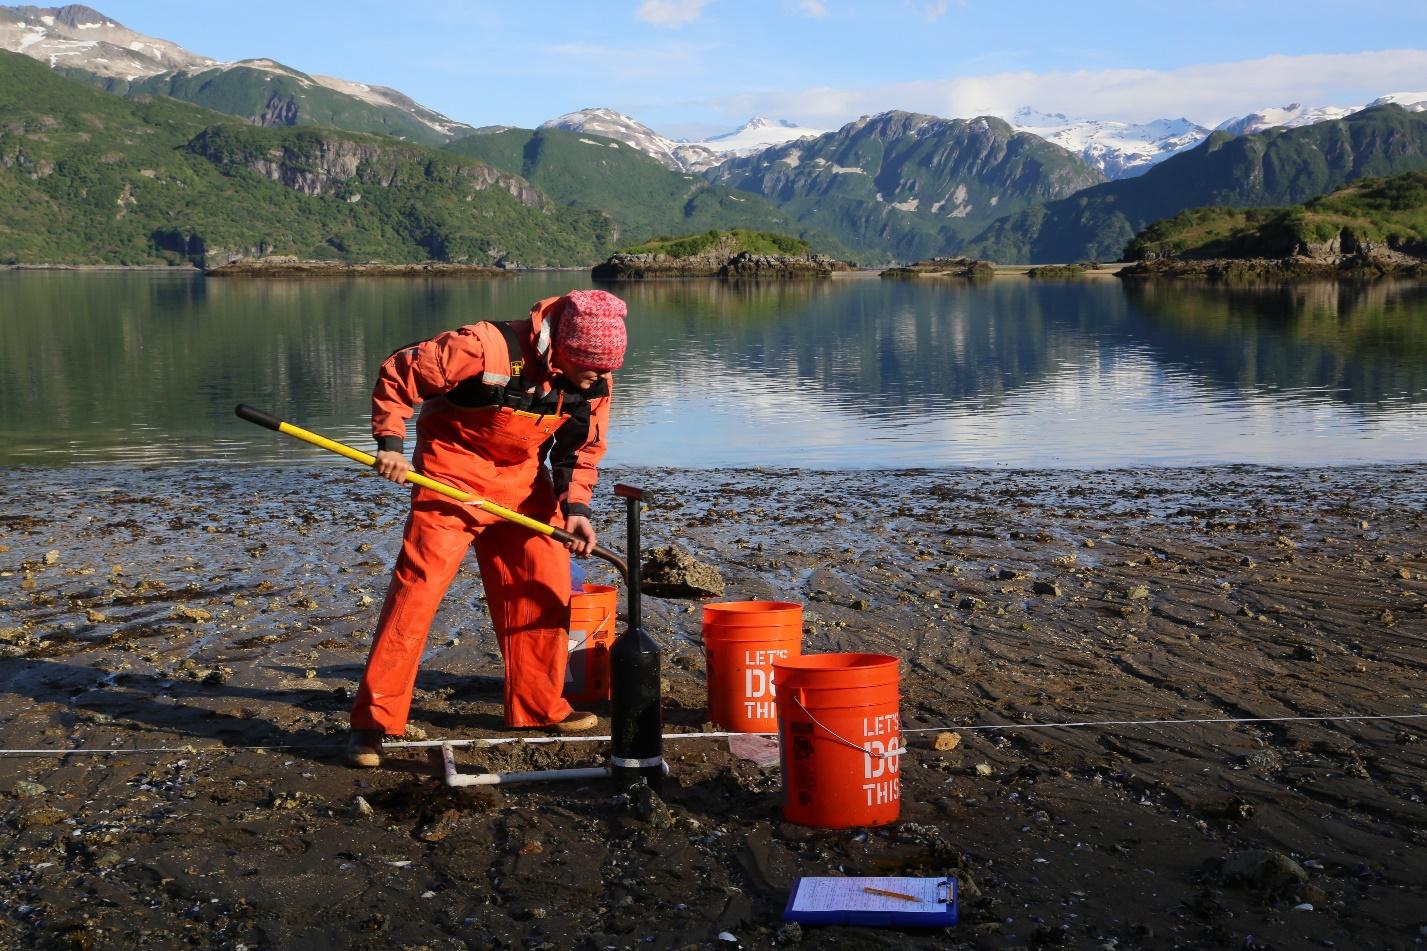
A SCIENTIST SAMPLES A QUADRAT FOR CLAMS AT A SOFT SEDIMENT SITE IN KATMAI NATIONAL PARK AND PRESERVE. PHOTO CREDIT: JIM PFEIFFENBERGER, NPS.
What are we finding?
Long-term monitoring of intertidal bivalves across the northern Gulf of Alaska shows continued variability in clam and mussel populations, with patterns differing among regions and over time. In 2025, overall clam density and biomass were slightly below long-term averages, although trends varied regionally. For example, clam biomass in Kachemak Bay increased in 2025 following several years of decline.
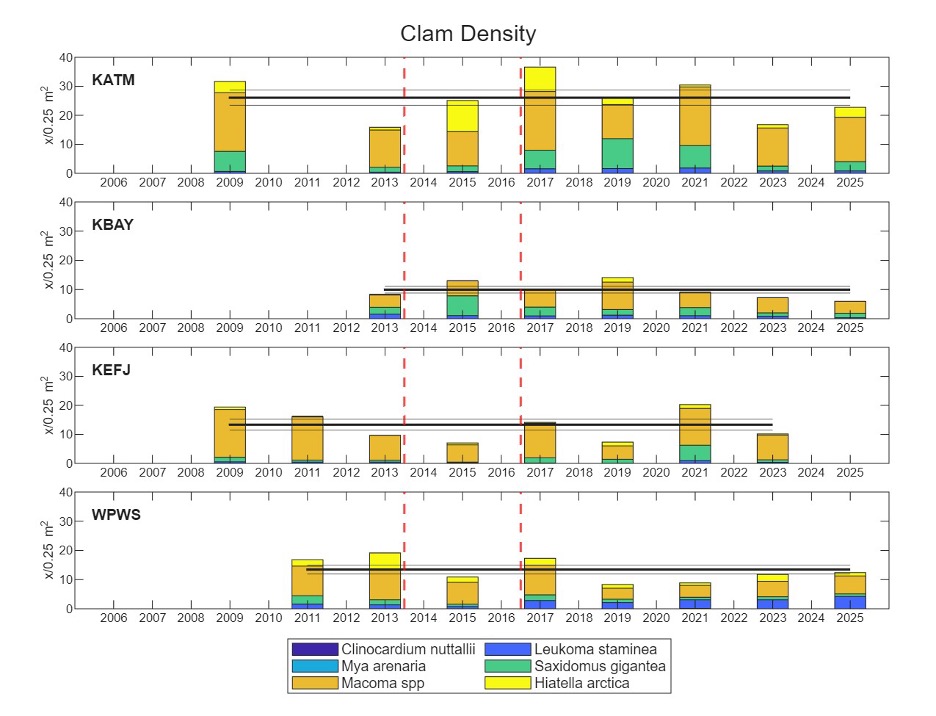
Clam density at the 0.0 m tidal elevation relative to mean lower low water (MLLW) across the four Gulf Watch Alaska regions: Katmai National Park and preserve (KATM), Kachemak Bay (KBAY), Kenai Fjords National Park (KEFJ), and Western Prince William Sound (WPWS). The black horizontal line shows regional long-term mean total clam density and the grey lines show ±1 standard error. Dashed red line indicates sampling years that fall within the Pacific marine heatwave.
Unlike some other nearshore indicators, there is no clear evidence that the Pacific marine heatwave had a consistent effect on clam populations across the study regions. Instead, variability in clam abundance and biomass appears to be influenced by a combination of local environmental conditions and biological interactions.
Mussel populations showed increases during and following the marine heatwave period, likely associated with reduced predation pressure from sea stars and increased available space following declines in macroalgae. However, more recent observations indicate that mussel abundance has become more variable, with some regions showing declines in recent years.
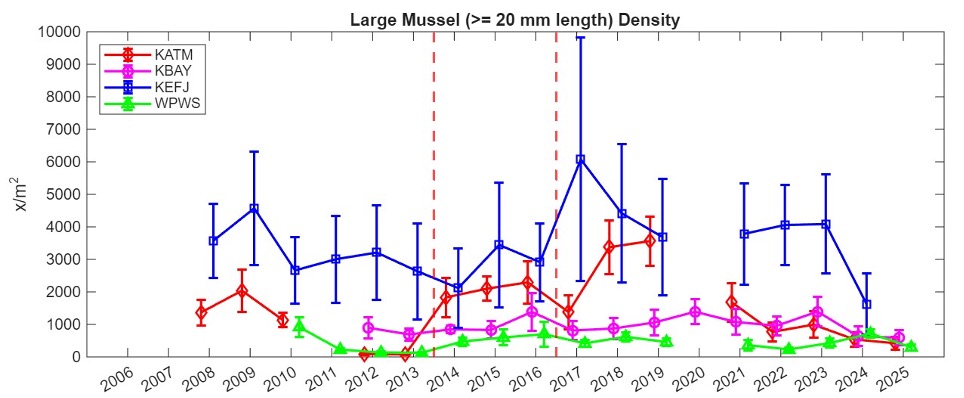
Large (>= 20 mm) mussel density across four regions at mussel sites through 2025. Sampling started in 2008 in Kenai Fjords National Park (KEFJ) and Katmai National Park and Preserve (KATM), in 2010 in Western Prince William Sound (WPWS), and in 2012 in Kachemak Bay (KBAY). Error bars indicate ±1 standard error. Dashed red line indicates sampling years that fall within the Pacific marine heatwave.
These patterns suggest that, in the absence of large-scale disturbances, local-scale drivers such as predation, environmental conditions, and habitat availability play an important role in shaping bivalve populations in nearshore ecosystems.