

Why are we monitoring?
Sea otters are an important component of nearshore ecosystems in the northern Gulf of Alaska. Sea otters have strong effects on prey communities and sea otter numbers and behavior reflect habitat conditions; because of these features, sea otters are particularly useful indicators of ecosystem status. We monitor several aspects of sea otter populations, including diet and energy intake rates based on foraging observations, age-at-death based on examination of carcasses, and distribution and abundance using aerial and skiff surveys. Through foraging observations, we can also use the sea otter to infer how the nearshore subtidal community is changing over time. Taken together, these metrics provide important insights on the status of sea otter populations and the condition of the environments in which they occur.
In addition to their important role within nearshore communities, sea otters are of high conservation interest in their own right, as a highly recognized and societally-valued marine mammal. Also, sea otter populations in the southwest Alaska population segment (which includes coastal habitat of Katmai National Park and Preserve) are listed as threatened under the Endangered Species Act. Monitoring sea otter populations, as well as other nearshore ecosystem components related to sea otter population health, will result in important information to better understand population status and trajectories (see Bivalves and Intertidal Communities).
Where are we monitoriing?
We monitor sea otters across a broad swath of the northern Gulf of Alaska within the area affected by the Exxon Valdez oil spill. Study regions include western Prince William Sound (WPWS), Kenai Fjords National Park (KEFJ), Kachemak Bay (KBAY), and Katmai National Park and Preserve (KATM).
How are we monitoring?
There are three different ways sea otter data are collected:
- Aerial surveys are conducted to estimate trend in sea otter density over time and map their distribution. Skiff surveys provide additional data on abundance and reproduction.
- Sea otter foraging data are collected annually to estimate diet composition and energy intake rates (Kcal/min), i.e., the amount of prey energy consumed per unit of time while an otter is foraging. These rates are used to indicate population status relative to a food-limited carrying capacity.
- Carcasses are collected to estimate the age-class distribution of dying otters, which provides insight as to the status of the population.
What are we finding?
Long-term monitoring of sea otters in the northern Gulf of Alaska shows region-specific population trends and shifts in diet over time. In 2025, abundance estimates indicate continued growth in western Prince William Sound, while populations in Katmai National Park appear stable or slightly declining.
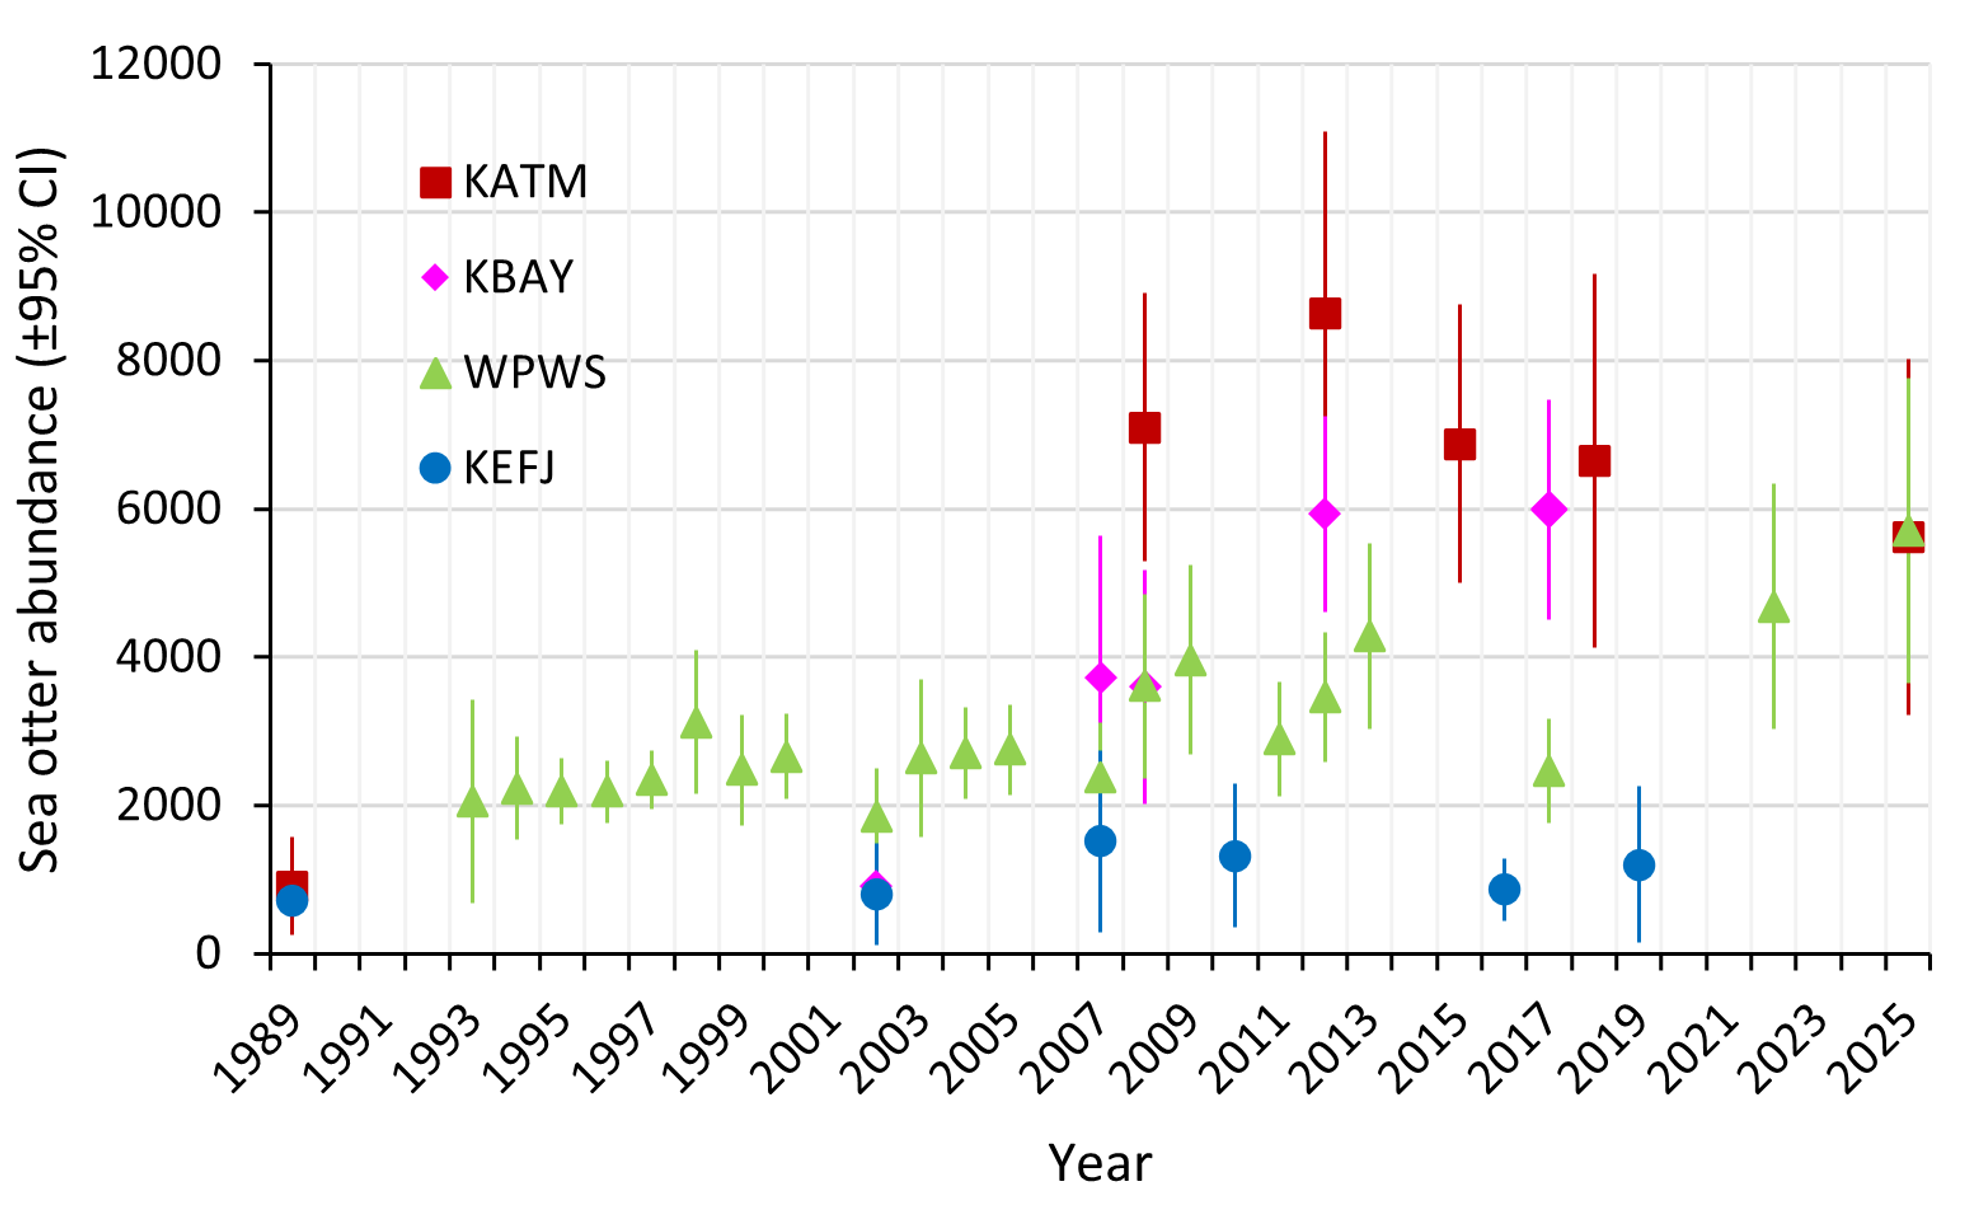
Mean estimated sea otter abundance by year for Katmai (KATM red), Kachemak Bay (KBAY purple), Kenai Fjords (KEFJ blue), and Western Prince William Sound (WPWS green).
Sea otter diet reflects both regional differences and changes in prey availability. In some areas, mussels have become a more prominent component of the diet during and after the Pacific marine heatwave, while clams and other invertebrates continue to contribute to foraging patterns across regions. In western Prince William Sound, sea urchins were more commonly observed as prey in recent years, suggesting greater dietary variability.
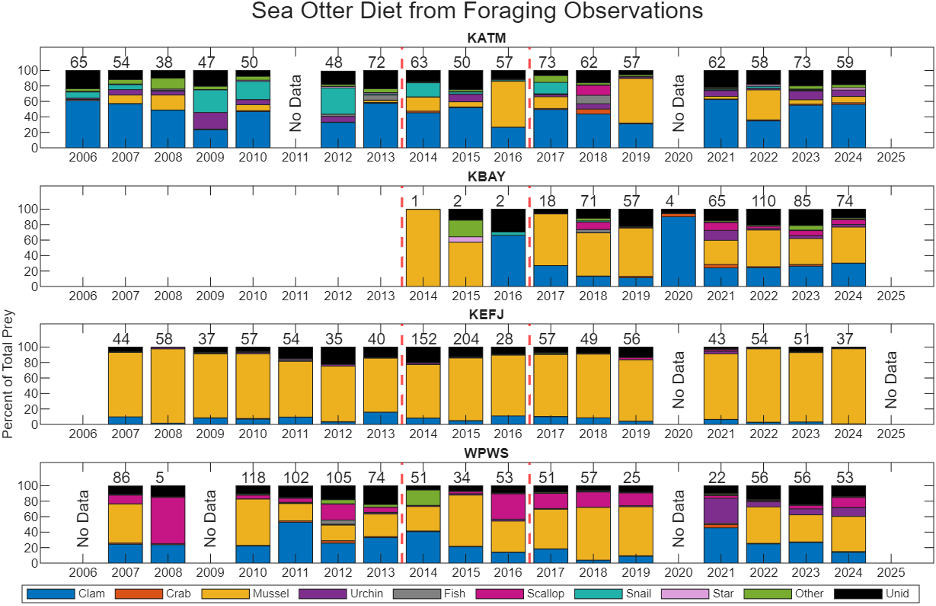
Proportion of total prey items observed being consumed by sea otters during foraging observation surveys. Numbers above the bars are the number of foraging bouts observed. Data collected at Katmai National Park and Preserve (KATM), Kachemak Bay (KBAY), and western Prince William Sound (WPWS) in 2025 are currently being processed and are not shown here. Dashed red line indicates sampling years that fall within the Pacific marine heatwave.
There is no clear evidence that sea otter populations responded strongly to the marine heatwave in terms of abundance. However, shifts in prey use suggest that sea otters are responding to changes in nearshore prey communities. These patterns highlight the role of sea otters as key predators in nearshore ecosystems and their importance in linking changes in lower trophic levels to higher-level ecosystem dynamics.