

Who We Are
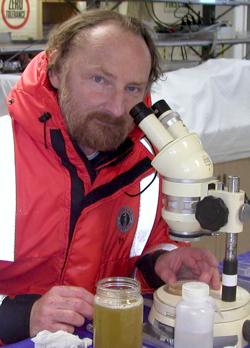
Russ Hopcroft, University of Alaska Fairbanks

Seth Danielson, University of Alaska Fairbanks
![]()
Why are we sampling?
The Gulf of Alaska (GOA) supports a diverse ecosystem that includes several commercially important fishes and culturally and economically important mammals and plants. Historic observations suggest a connection between the GOA ecosystems and climate variations that range from interannual to interdecadal; however, the specific mechanisms by which climate variation causes ecosystem changes are poorly understood. Sampling along the Seward line produces a multi-year data set that lets us better understand the seasonal cycle and the yearly variability in environmental conditions and biological productivity in the Gulf of Alaska.
Where are we sampling?
The Seward line is a transect of oceanographic survey stations that begins at the GAK1 mooring at the mouth of Resurrection Bay in the Gulf of Alaska (59°50.7’N, 149°28.0’W) and continues south across the Gulf of Alaska to the outer edge of the continental Shelf, or “shelf break” (58°5.9’N, 147° W). It is now embedded in the Northern Gulf of Alaska Long-term Ecological Research (NGA-LTER) program that adds additional lines from the Copper River to past Middleton Island and from Kodiak’s Albatross bank to offshore waters.
How are we sampling?
We sample the Seward line in early May, mid-summer (July), and mid-September from a research vessel and collect data about various environmental and biological conditions from salinity and temperature to plankton. The water column is sampled using a CTD (conductivity, temperature, depth) profiling instrument, plankton nets, and instruments that sample the water from different depths to evaluate carbonates for ocean acidification monitoring. While physical data are read directly from instruments, chemical and biological data require considerable post-cruise laboratory analyses.
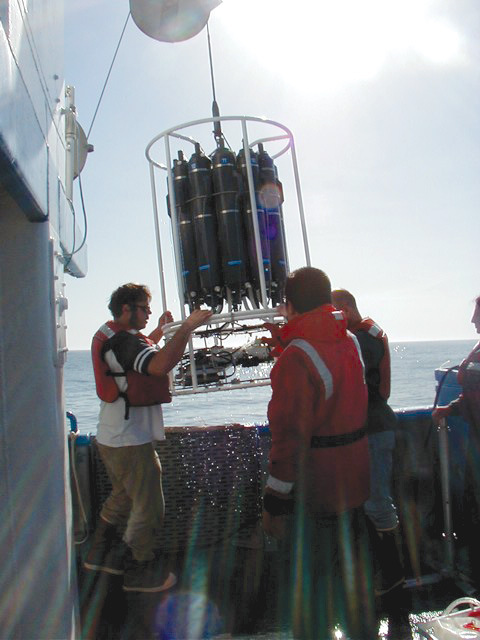
Deployment of the CTD and water collection system that measures salinity and temperature continuously during its vertical descent to the ocean floor, up to 2200 m below the vessel.
What are we finding?
Observations along the Seward Line indicate continued warm ocean conditions in the northern Gulf of Alaska. In 2025, temperatures in the upper 100 m were above the long-term average in both spring and fall, with fall conditions among the warmest in the time series despite neutral or negative climate indices.
Spring phytoplankton biomass was relatively low, with communities dominated by smaller cells that are less efficiently transferred to higher trophic levels. Chlorophyll concentrations were highest on the outer shelf but remained modest overall. Zooplankton patterns reflected these conditions. In spring, the biomass of large copepods (Neocalanus) was below average, and development appeared delayed, consistent with lower food availability. In fall, overall copepod abundance remained low, with limited contribution from warm-water species despite elevated temperatures.
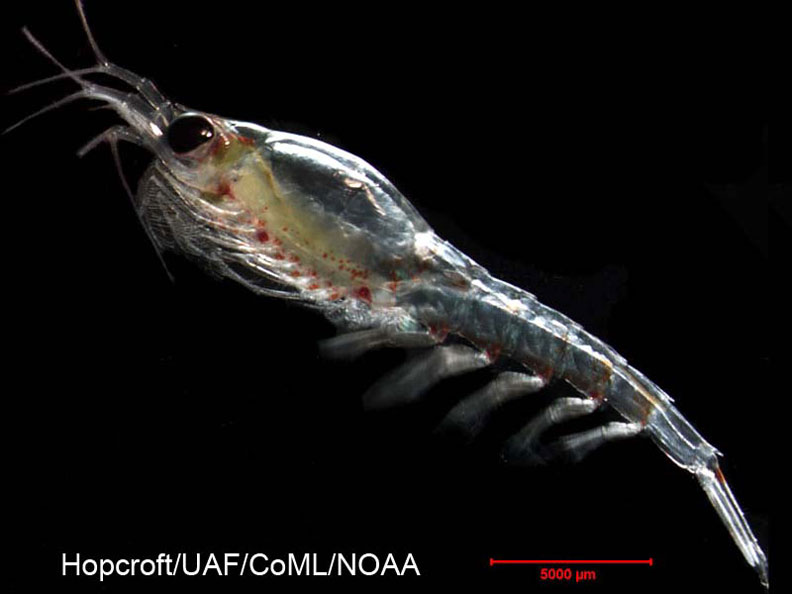
These patterns suggest that factors beyond temperature, such as food availability and ocean circulation, play an important role in structuring plankton communities. In contrast, euphausiids appeared relatively abundant, indicating differing responses among zooplankton groups. Overall, these observations point to a system where warm conditions do not consistently translate into increased biological production, highlighting the complexity of ecosystem responses to changing ocean conditions.
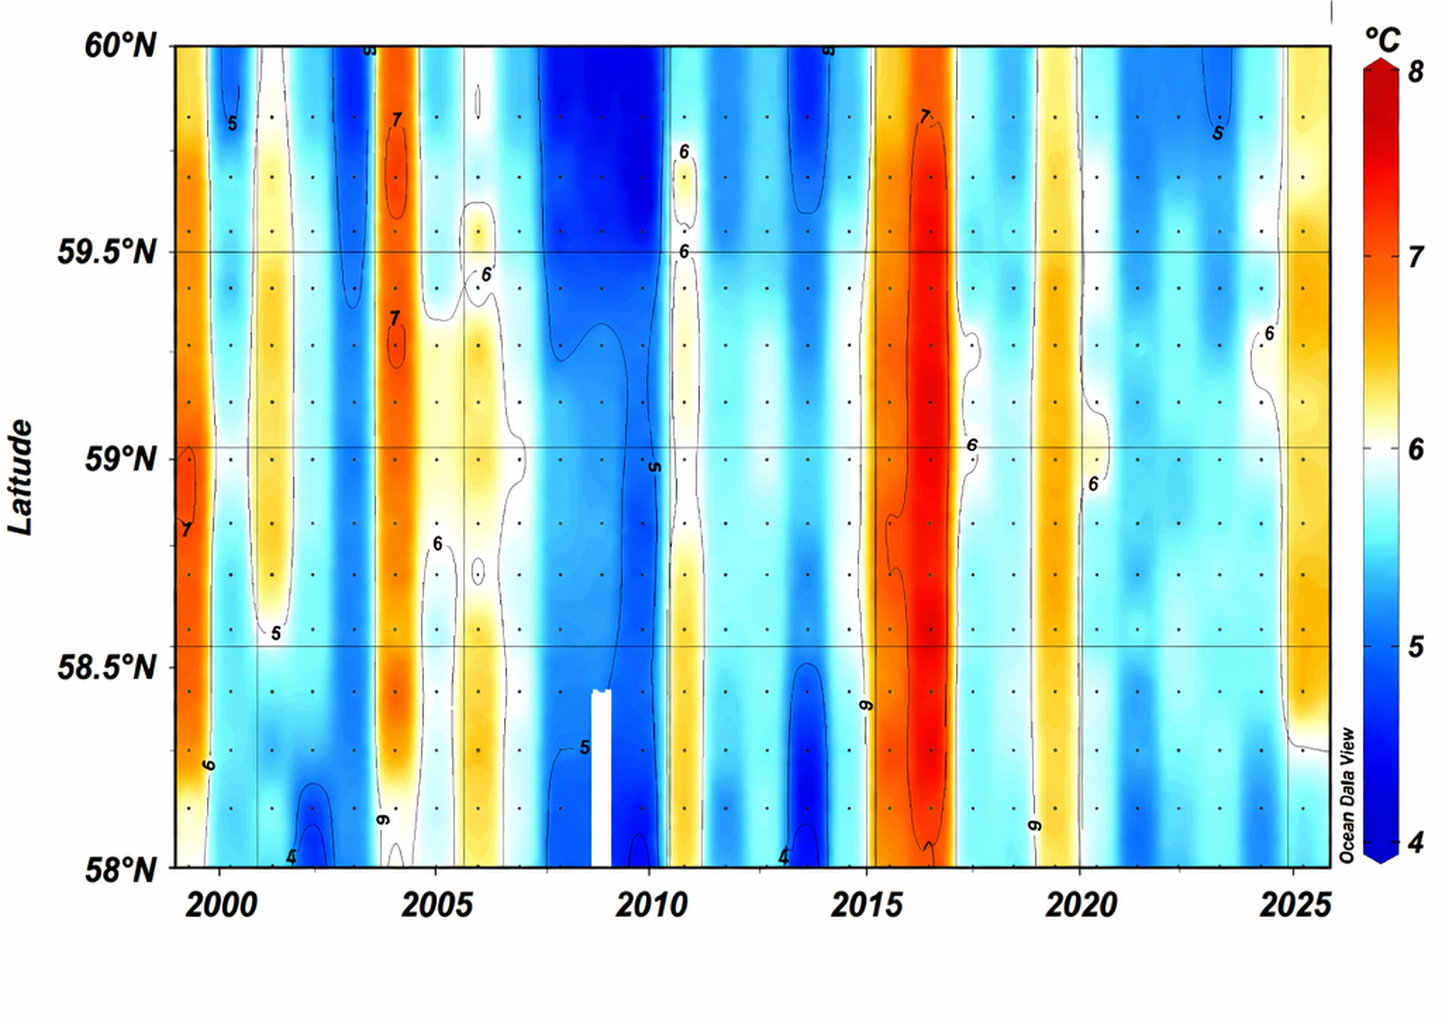
EARLY MAY TEMPERATURE AVERAGES FOR THE UPPER 100M ALONG THE SEWARD LINE.