

Who We Are
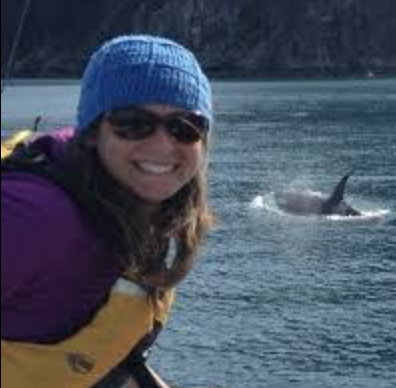
Claudine Hauri, International Arctic Research Center, University of Alaska Fairbanks
Why are we sampling?
Ocean acidification and warming are putting an additional strain on a marine ecosystem that is slowly recovering from the 1989 Exxon Valdez Oil Spill. The high latitude Gulf of Alaska ecosystem is especially vulnerable to ocean acidification and requires high-resolution in-situ observations to characterize the natural inorganic carbon variability and monitor the progression of ocean acidification and climate change. High-resolution ocean acidification monitoring was conducted along the historic Seward Line between 2008 and 2017. Unfortunately, this effort was reduced to just 4-5 stations per cruise in 2018, terminating a time series that was starting to help us understand natural variability and local drivers and define ocean acidification hotspots and potential impacts on the ecosystem. In addition to extending the temporal and geographic coverage of a critical data set, the sampling plan includes the new Kodiak Line, which passes by highly productive areas near current and planned future mariculture grounds suggested to be an ocean acidification hotspot. Understanding the current chemical conditions and progression of ocean acidification is of high socio-economic importance to the region. Overall, the proposed project will help to distinguish the effects of the oil spill from the effects of ocean acidification on the ecosystem and manage sensitive or injured species and resources.
Where are we sampling?
High-resolution ocean acidification monitoring will be reinstituted along the Seward Line and in Prince William Sound in May, July, and September, and expand monitoring along an additional transect off Kodiak.
How are we sampling?
We will tag along the National Science Foundation funded Northern Gulf of Alaska Long-Term Ecosystem Monitoring cruises and collect water samples at stations within the Exxon Valdez oil spill area. We have revised the open-ocean sampling techniques to guarantee high-quality data from this glaciated and estuarine environment. To avoid compromising our inorganic carbon seawater samples we will filter the dissolved inorganic carbon (DIC), pH, and total alkalinity (TA) samples straight from the Niskin bottles into pre-cleaned 500 mL borosilicate bottles and add mercuric chloride (HgCl2) to the sample. DIC and pH will be analyzed simultaneously to avoid influence of air-sea gas exchange.
What are we finding?
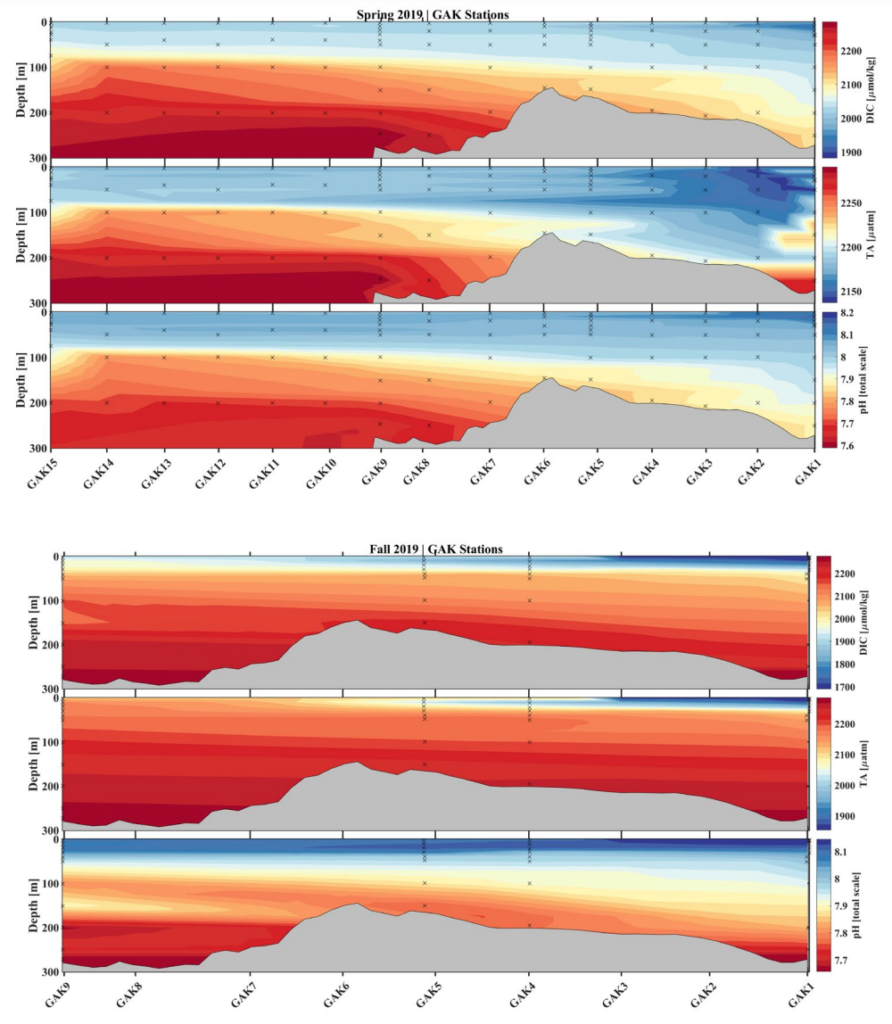
Long-term monitoring of ocean acidification in the northern Gulf of Alaska shows consistent seasonal patterns and emerging trends in carbonate chemistry. Surface waters have higher pH in spring due to phytoplankton uptake of carbon, while fall conditions reflect increased freshwater input, resulting in lower salinity, reduced total alkalinity, and lower pH.
Across the Seward Line time series (2008–2024), bottom waters show increasing dissolved inorganic carbon (DIC) during the fall, alongside declining aragonite saturation state at multiple stations. In contrast, surface waters show decreasing DIC over time, consistent with an increasing influence of freshwater input, which may partially buffer surface acidification. Recent observations also show persistent aragonite undersaturation in bottom waters across the continental shelf, with undersaturated conditions shoaling to shallower depths in some years. These conditions can affect calcifying organisms, such as pteropods.
While the time series remains relatively short and influenced by natural variability, these patterns point to increasing vulnerability of subsurface waters to ocean acidification.
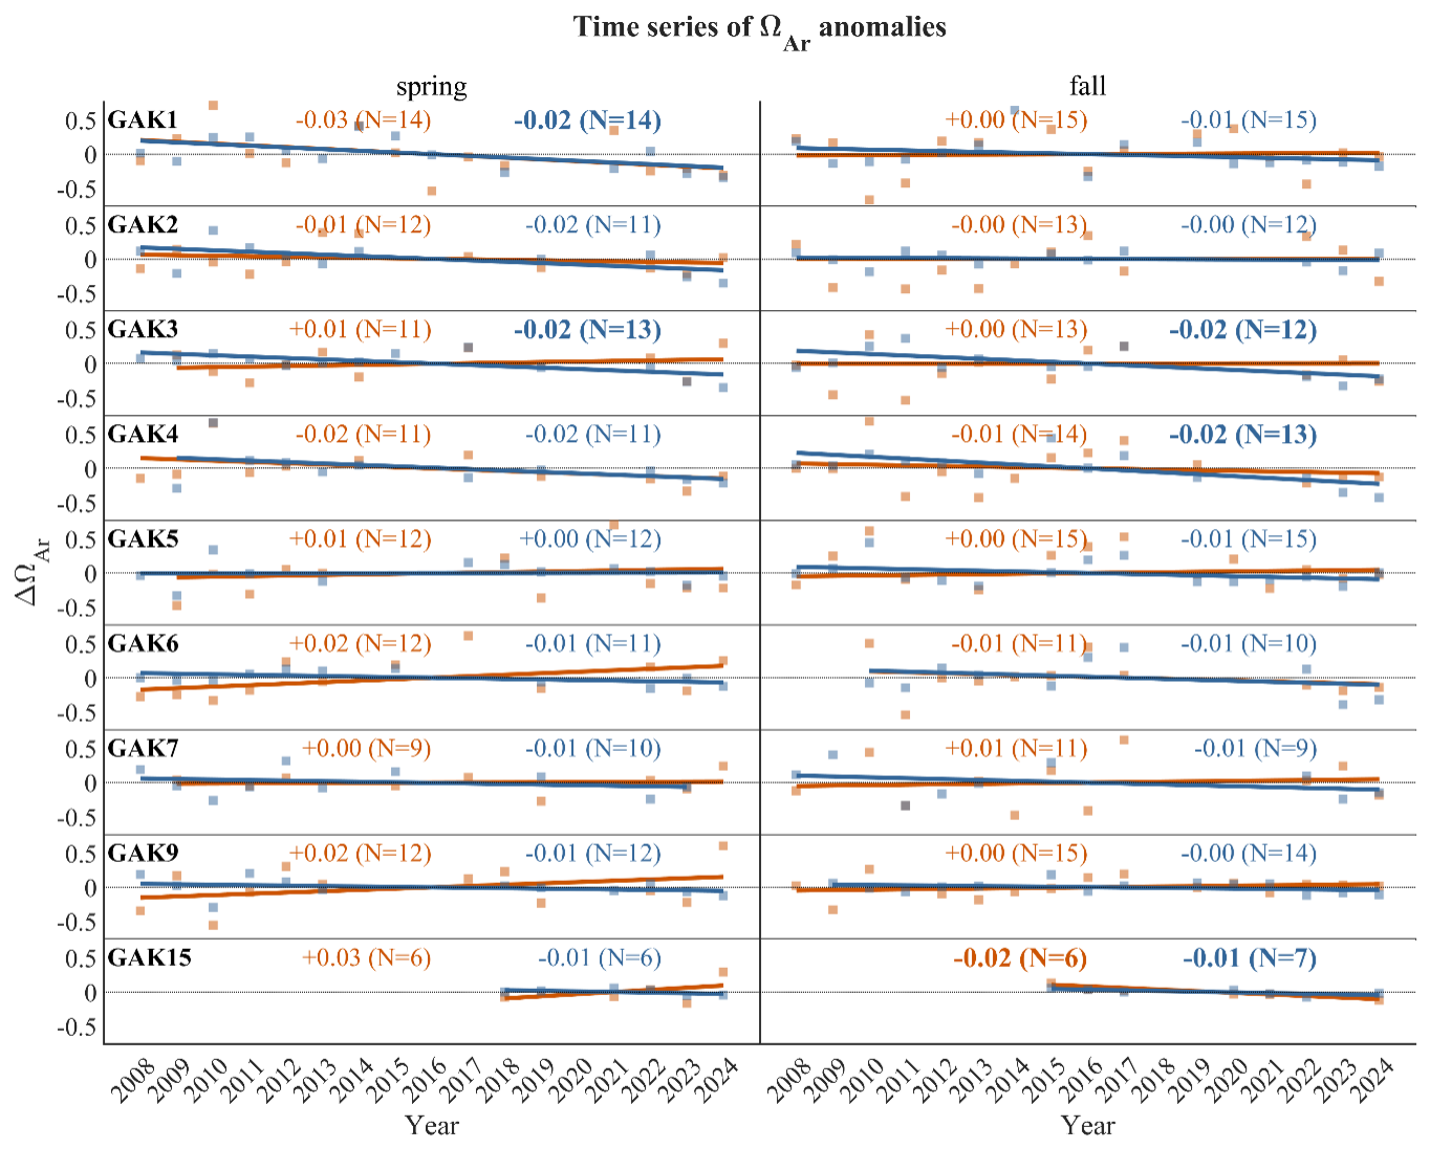
Observed aragonite saturation state (Ωarag) trends along the Seward Line (2008–2024). Time series of annual mean Ωarag anomalies derived from spring (right panels) and fall (left panels) cruises in surface-water (orange squares) and bottom-water (blue squares) for Seward Line stations from GAK1 offshore (top to bottom). Anomalies were calculated by removing the station- and layer-specific mean of the annual values over the full record. Solid colored lines show linear trends estimated from annual values, with trend slopes (yr⁻¹) reported in the upper-right half of each panel. Significant trends (p-value < 0.05) are shown in bold. Stations shown are those where trends are available for both spring and fall, with station labels shown in the right panels.