

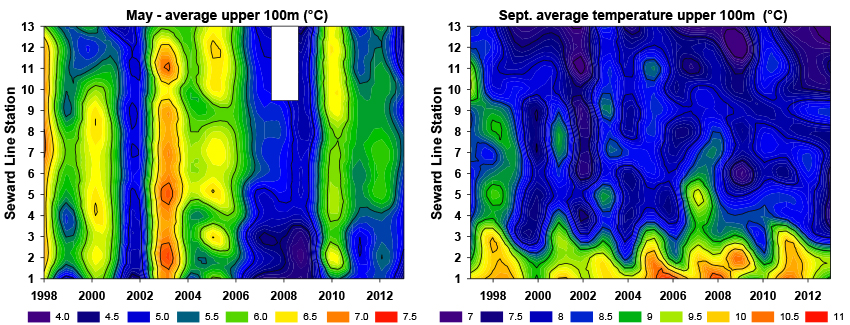
Average temperatures for May and September along the Seward line (Station 1 is most nearshore, increasing numbers moving offshore) from 1997-2013. Temperature colors are shown in degrees Celsius across the bottom.
Average temperatures for May and September along the Seward line (Station 1 is most nearshore, increasing numbers moving offshore) from 1997-2013. Temperature colors are shown in degrees Celsius across the bottom.