

Who We Are

Rob Campbell, Prince William Sound Science Center
![]()
Why are we sampling?
Marine ecosystems are not static over time; they may change gradually from year to year or shift abruptly. Changes are in part driven by factors that operate from the “bottom up,” such as environmental changes (e.g., changes in temperature, salinity, or turbidity) and biogeochemical dynamics that affect the availability and recycling of nutrients. Long term monitoring of the area affected by the Exxon Valdez oil spill is important, not only to assess the recovery of resources, but also to understand how the ecosystem is changing over time. This project provides physical and biological measurements that can be used to assess environmental conditions that have bottom-up influences on the marine ecosystems of Prince William Sound.
Where are we sampling?

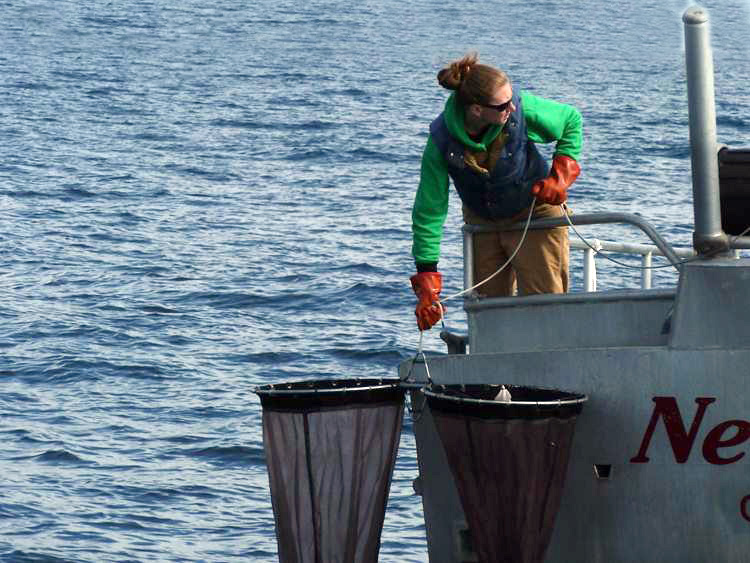
Gulf Watch scientist Rob Campbell prepares a CTD instrument for oceanographic sampling in Prince William Sound.
We deploy an autonomous moored profiler (AMP) in central Prince William Sound and conduct several regular vessel surveys within Prince William Sound (PWS). Vessel surveys visit the mooring site, four historically sampled bays, and the major entrances (Hinchinbrook Entrance and Montague Strait) of PWS. See map at right.
How are we sampling?
The AMP (see the diagram below) measures temperature, salinity, oxygen concentration, chlorophyll-a concentration, turbidity, and nitrate concentration as it ascends from 60 m to the surface each day. In 2016 we added a plankton camera which is an “underwater microscope” that takes pictures of individual plankton as the profiler moves up in the water.
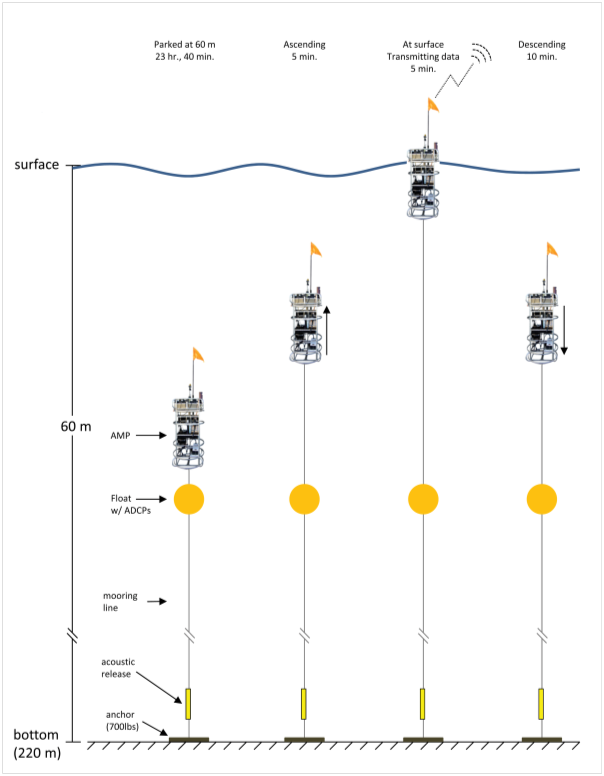
A TYPICAL PROFILE CYCLE DONE BY THE AMP PROFILER. THE PROFILER SPENDS MOST OF ITS TIME AT A SPECIFIED PARK DEPTH (50-60 M), WHICH KEEPS IT AWAY FROM SURFACE TRAFFIC AND WAVES AND MINIMIZES BIOFOULING. AT SPECIFIED INTERVALS (USUALLY DAILY), THE PROFILER CONTROLLER WAKES FROM ITS LOW POWER SLEEP STATE, POWERS UP THE INSTRUMENTS, AND ASCENDS TO THE SURFACE AT 25-30 CM PER SECOND. AT THE SURFACE, THE CONTROLLER CONNECTS INTO A SERVER VIA A CELLULAR MODEM TO SEND OUT DECIMATED DATA AND RECEIVE NEW PROFILING INSTRUCTIONS. AFTER A SHORT TIME AT THE SURFACE, THE PROFILER WINCHES ITSELF BACK TO THE PARK DEPTH.
In addition, we conduct vessel surveys six times per year at selected stations throughout Prince William Sound. At each sampling station, we collect water for nutrient and chlorophyll-a analysis, collect plankton, and complete a conductivity-temperature-depth (CTD) cast to collect the same type of data with the same instrumentation as that collected by the instrument on the AMP.
What are we finding?
Long-term monitoring in Prince William Sound shows continued changes in ocean conditions, including warming surface waters, increasing freshwater input, and a thinning surface mixed layer. Near-surface temperatures have remained mostly above average since 2013, with periodic marine heatwave conditions, while surface salinity shows a long-term freshening trend. The depth of the surface mixed layer has declined over time, likely driven by warming and increased freshwater input. A shallower mixed layer limits the amount of nutrients available in surface waters, which may influence overall productivity.
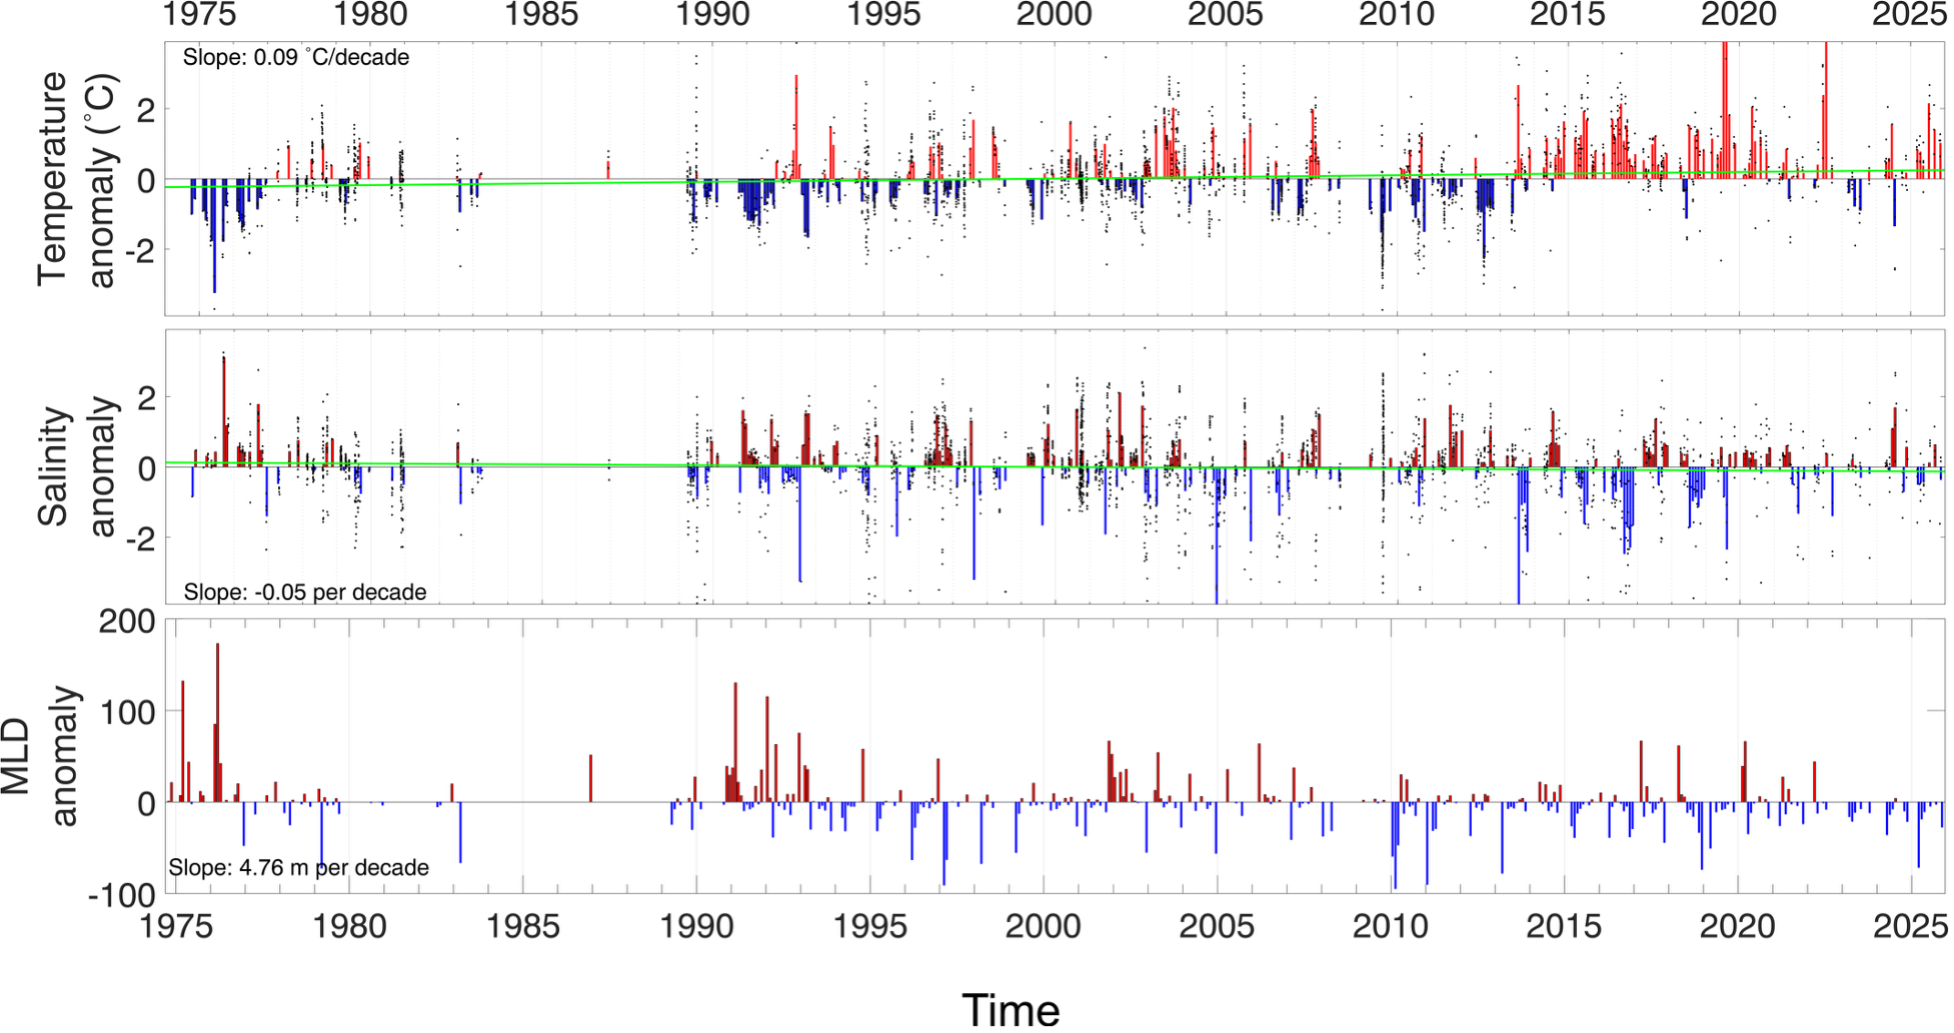
Top panel: Biweekly near surface temperature anomalies in central Prince William Sound. Anomalies were calculated as the residual to a second order cosine curve fit to all years data (to remove seasonality [Campbell 2018]). Black points are observations, bars are biweekly averages, and the green line indicates the linear trend. Middle panel: near surface salinity anomalies calculated with the same method. Bottom panel: Monthly mixed layer depth anomalies.
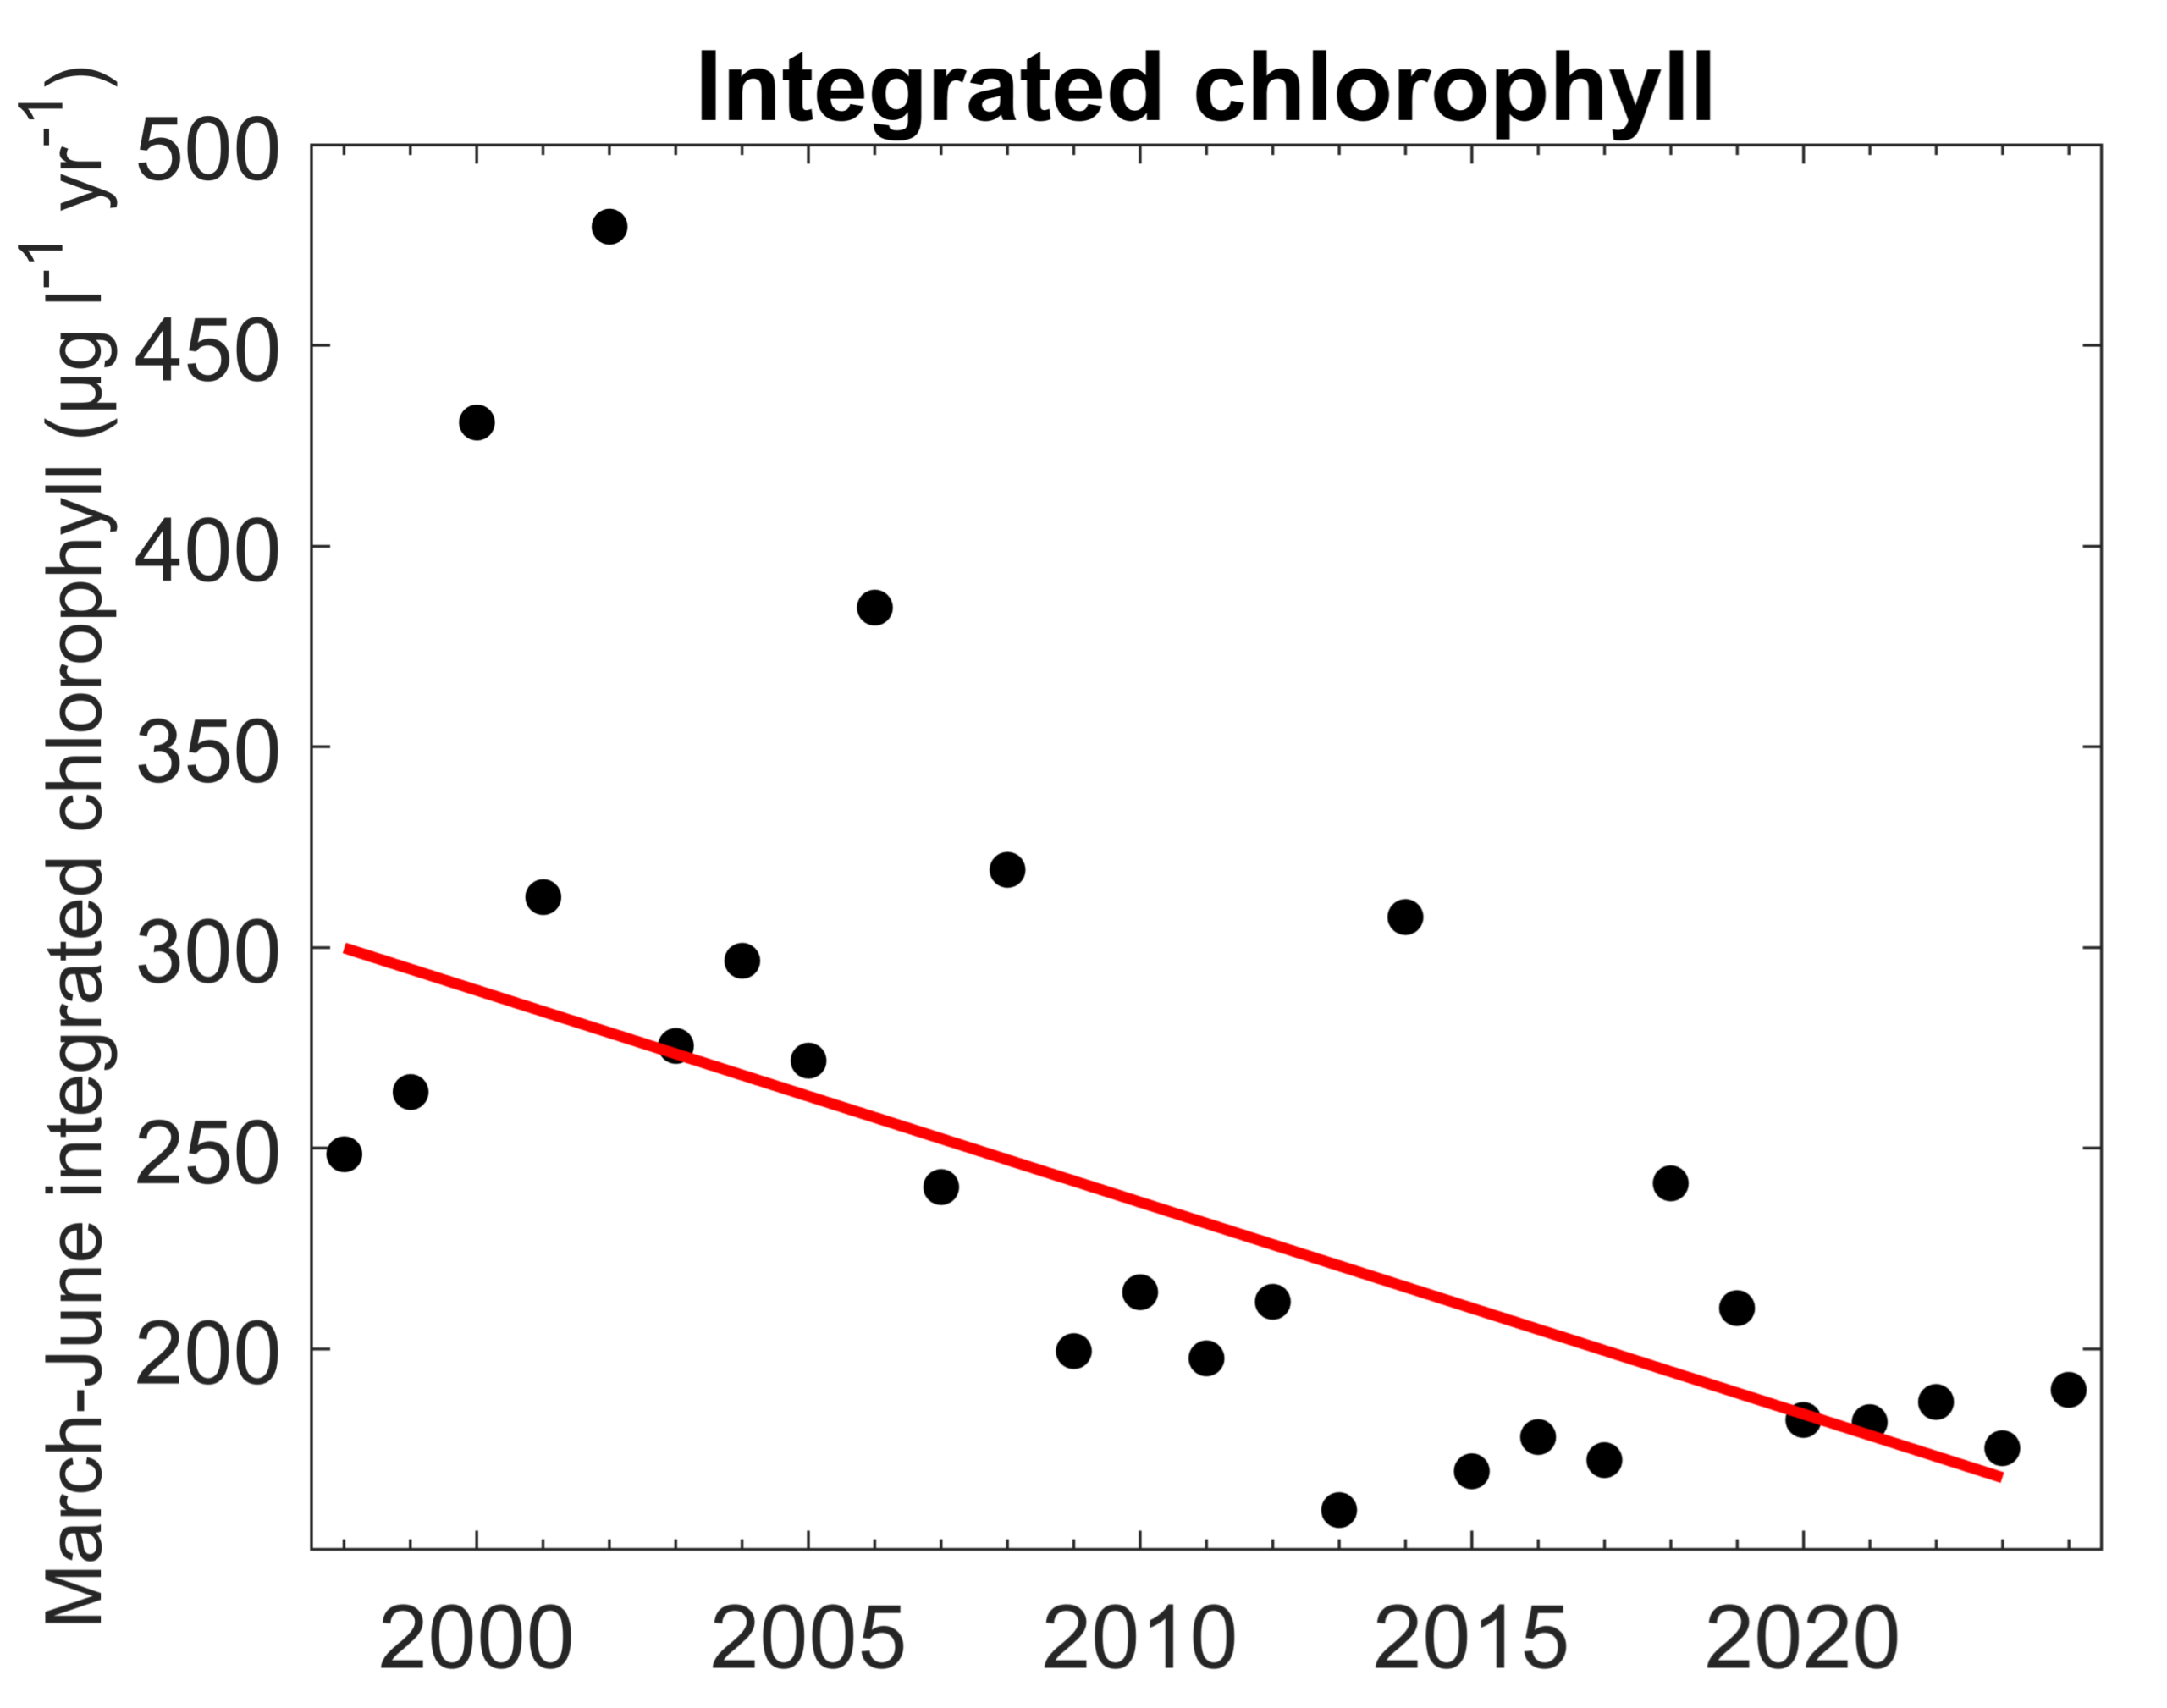
Annual spring-summer chlorophyll-a in central Prince William Sound (PWS), 1998-2025.
Zooplankton communities have also shifted in response to changing conditions. During marine heatwave periods, warm-water species increased while cool-water species declined, with a return toward cooler-water assemblages following cooler periods. In recent years, overall zooplankton abundance has trended below average.
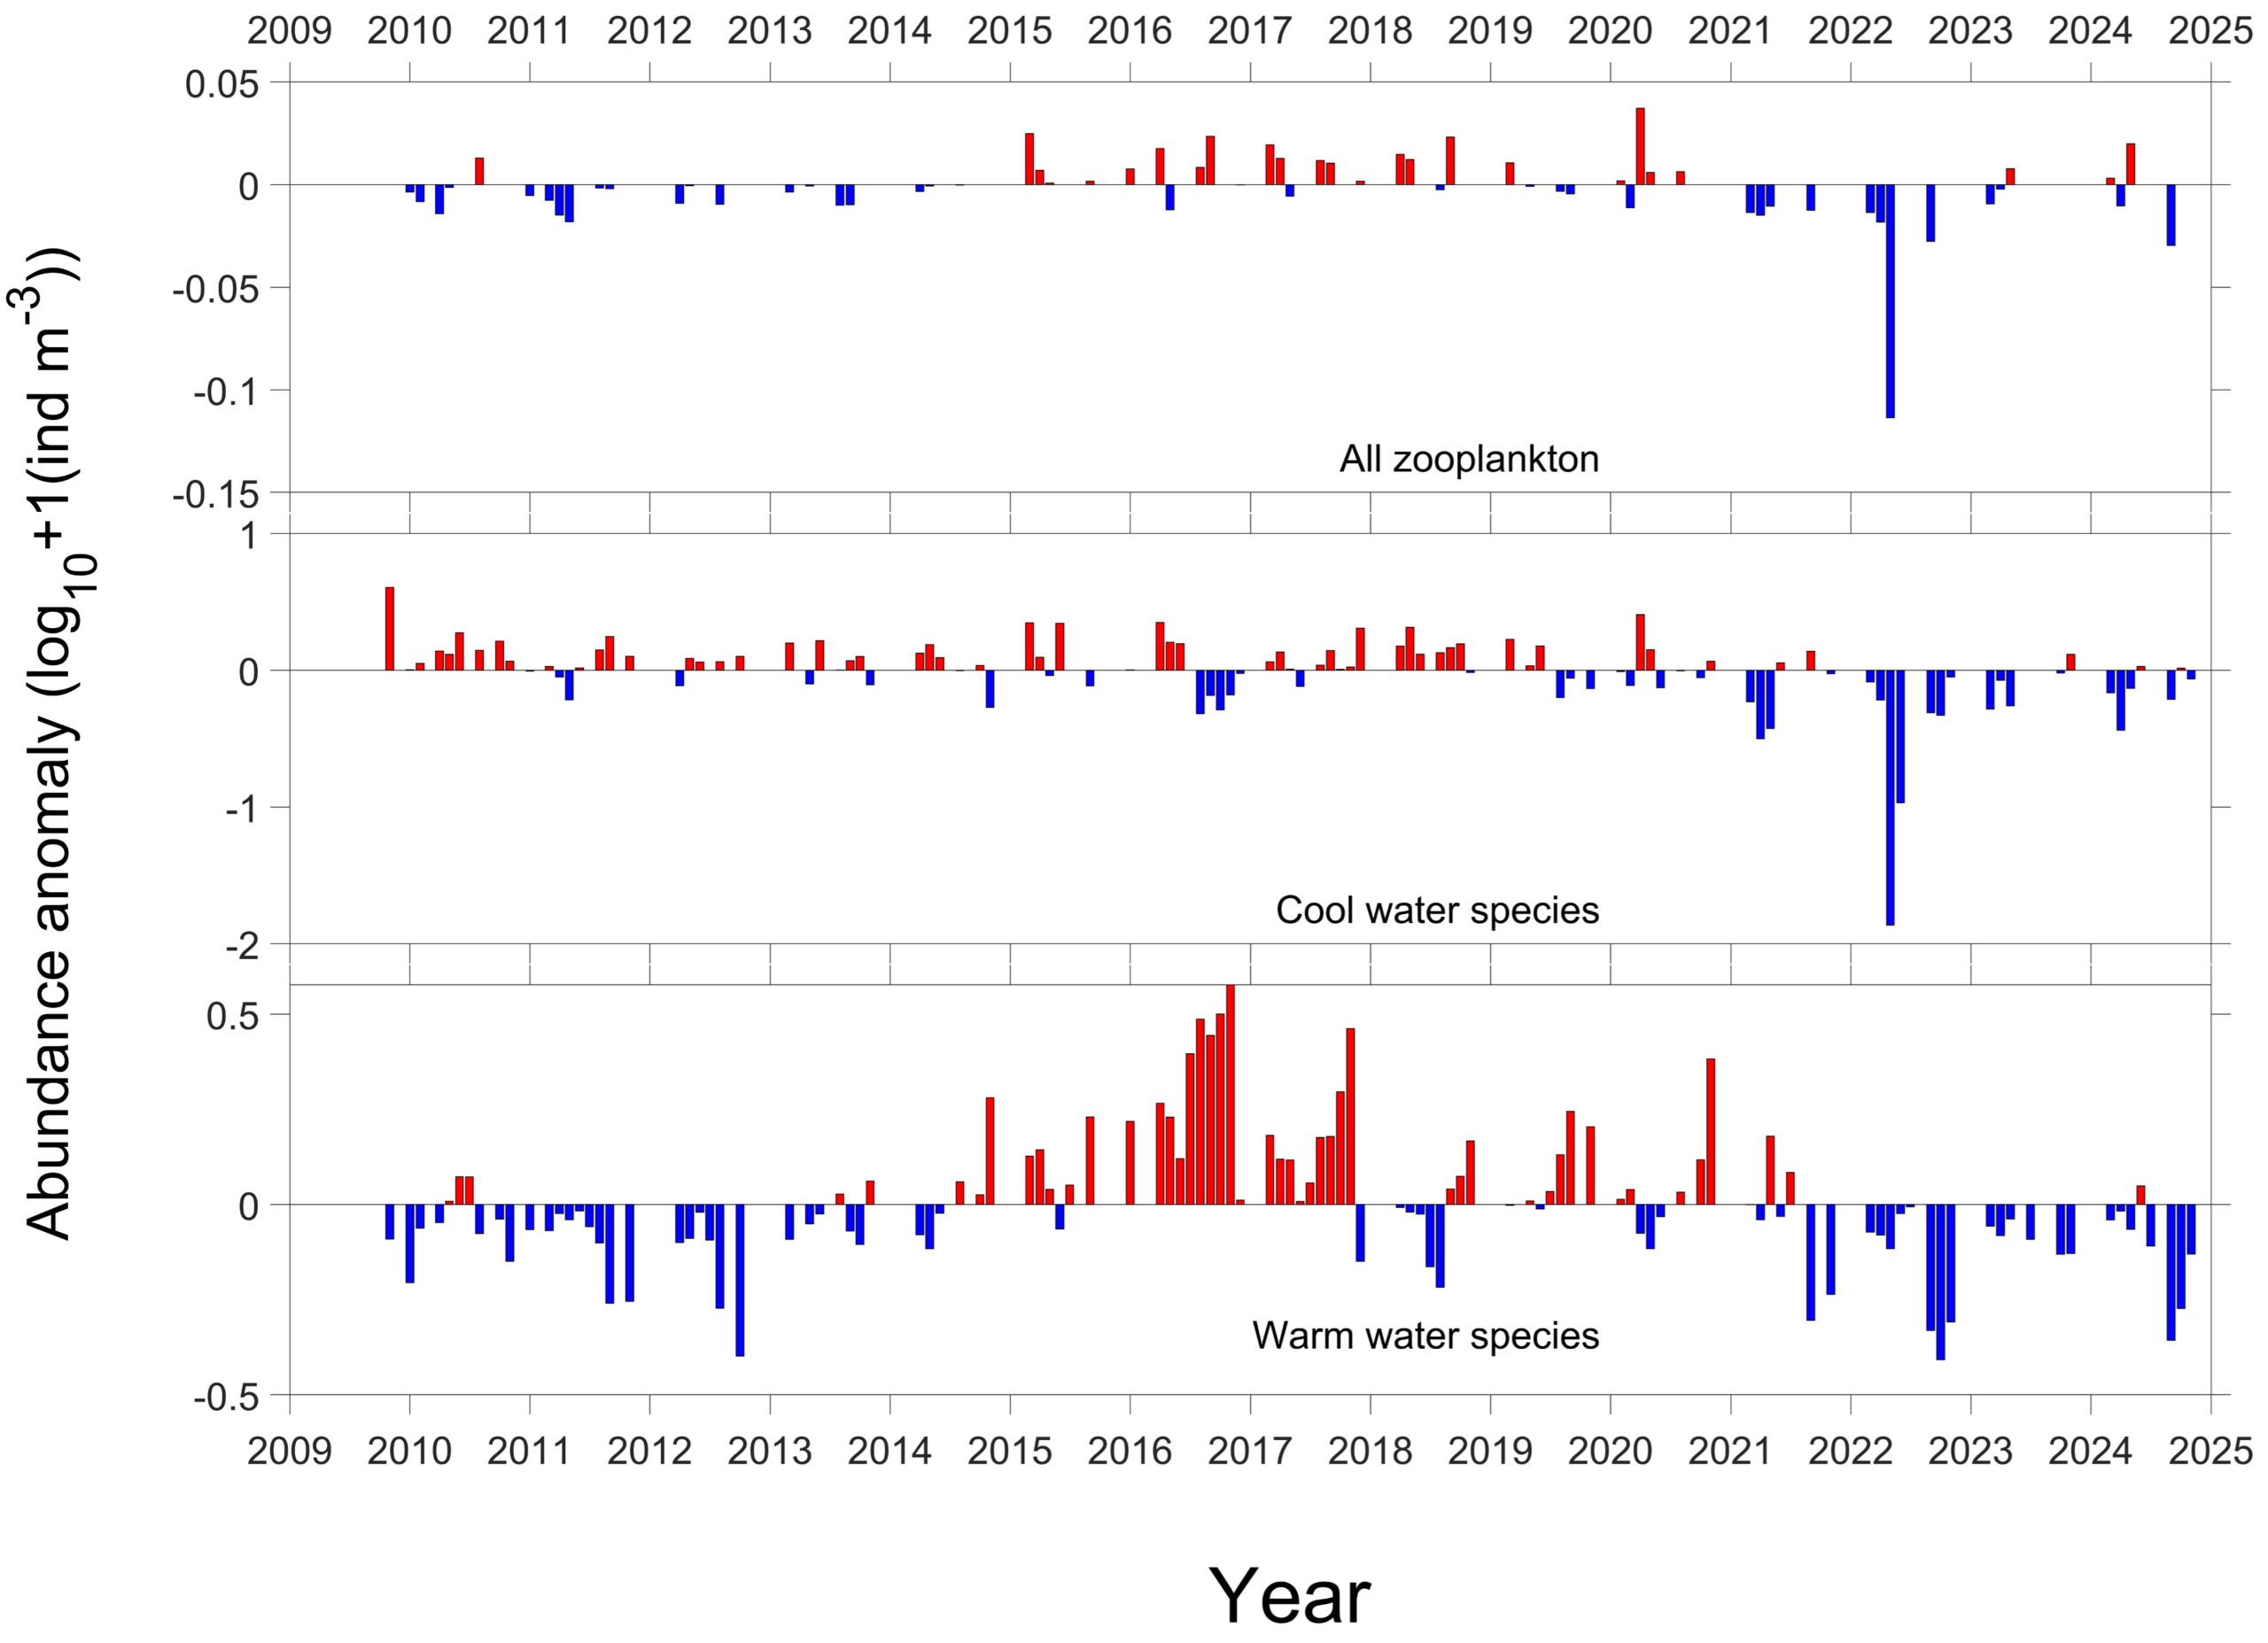
Time series of zooplankton anomalies in Prince William Sound, 2010-2023. Zooplankton were divided into “warm” and “cool” water copepod species and average anomalies calculated across groups.